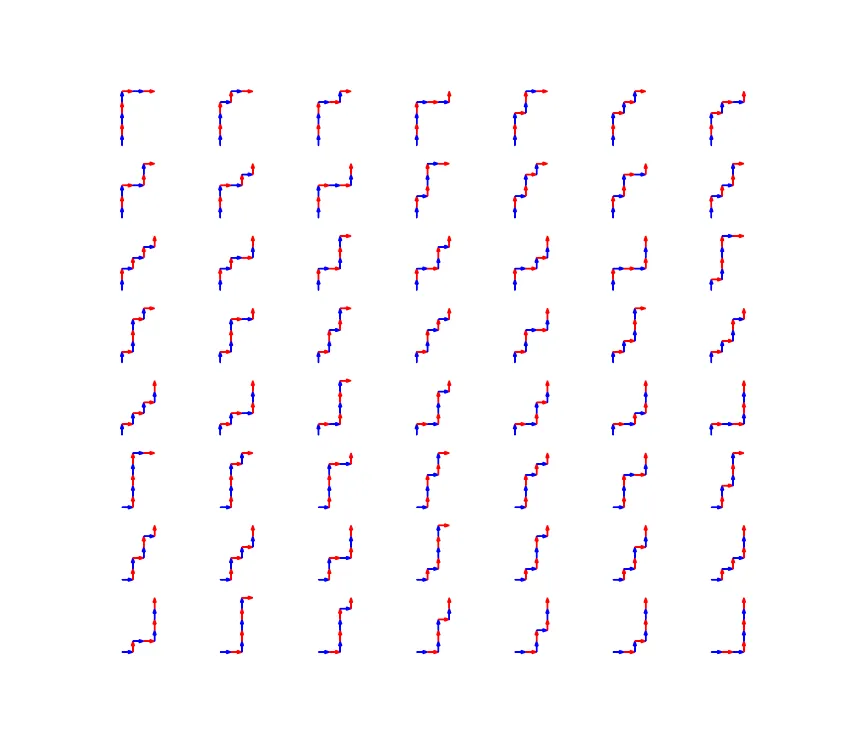
If you start at (0,0) and can take one step at a time either north (0,+1) or east (+1,0), how many different ways are there to get to (3,5)?
I wanted to augment this answer on Quora with a visual representation of all the lattice paths originally given in textual form.
A quick and dirty way of generating all the possible paths in Python is this two-line solution:
import itertools

allPaths = [ "".join( x ) for x in itertools.product( "NE", repeat=8 )
             if x.count( "N" ) == 5 and x.count( "E" ) == 3 ]
This is by no means the most efficient way, but it suffices for small values. There should be (5+3) choose 3 = 56 such paths.
I chose to graph them with matplotlib, which made it pretty easy to do one subplot per path.
Problems I encountered:
- Arrowheads extending beyond x=0 or y=0 got trimmed. I solved this by moving my starting position up and to the right.
- matplotlib tried to scale each subplot to the full width and height of the box, but this meant that the arrows were no longer the same length. I used
ax.set_aspect('equal', 'box' )to keep the aspect ratio equal. - Each graph is small enough that the arrowheads don't really stand out. I tried playing with the sizes without much success, and settled on alternating colors instead. I'm not entirely happy with red + blue, but green + blue didn't have much contrast.
Plot
Source Code
import matplotlib.pyplot as plt

length = 0.18
width= 0.001
head_width = 0.05

def drawPath( ax, path ):
    x = 0.0 + head_width
    y = 0.0 + head_width
    color = "blue"

    ax.set_aspect('equal', 'box' )
    for d in path:
        if d == "N":
            dx = 0.0
            dy = length
        else:
            dx = length
            dy = 0.0
        ax.arrow( x, y, dx, dy,
                  width = width,
                  head_width = head_width,
                  color = color,
                  length_includes_head = True )
        x += dx
        y += dy
        if color == "blue":
            color = "red"
        else:
            color = "blue"

for i, p in enumerate( allPaths ):
    ax = plt.subplot( 8, 7, i + 1 )
    ax.axis( "off" )
    drawPath( ax, p )

plt.show()