
SUMMARY
RIPPLE (XRP) is likely reaching for the 0.618 Fibonacci level. In pursuit of Bitcoin's lead, the chart below shows that the five waves of the red c wave has yet to be tagged. Given how Bitcoin is expected to target the $8k or $7,500 or so level; XRP is likely to generate a lower low.
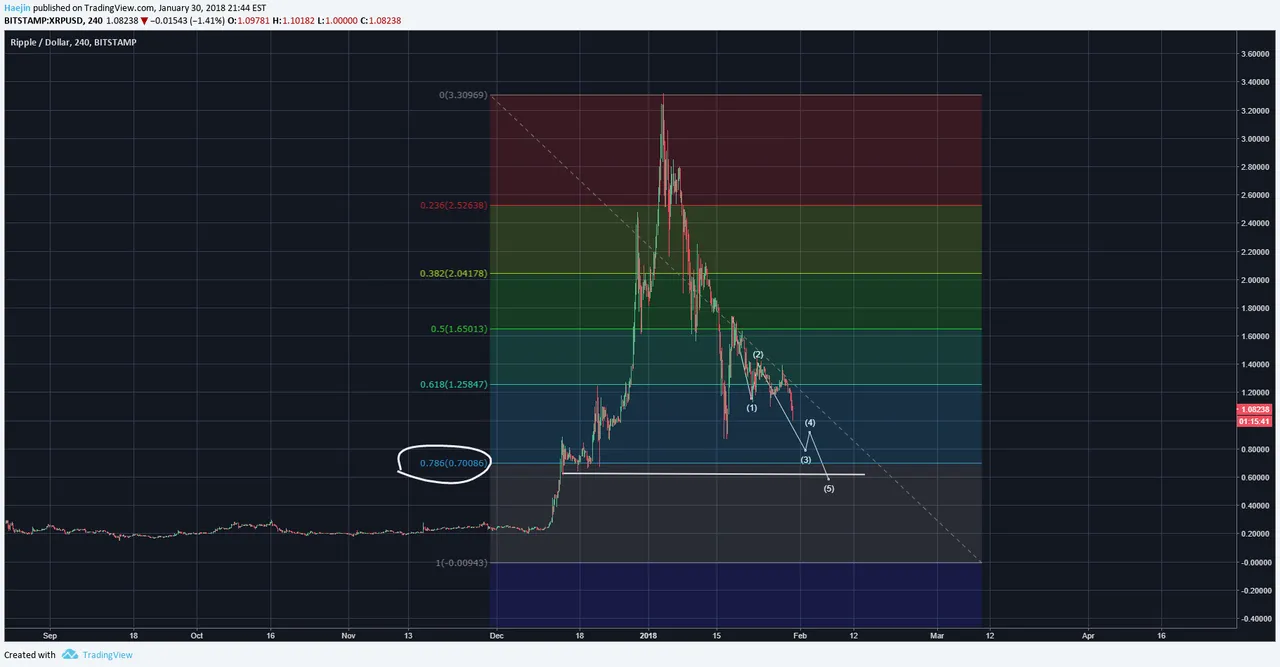
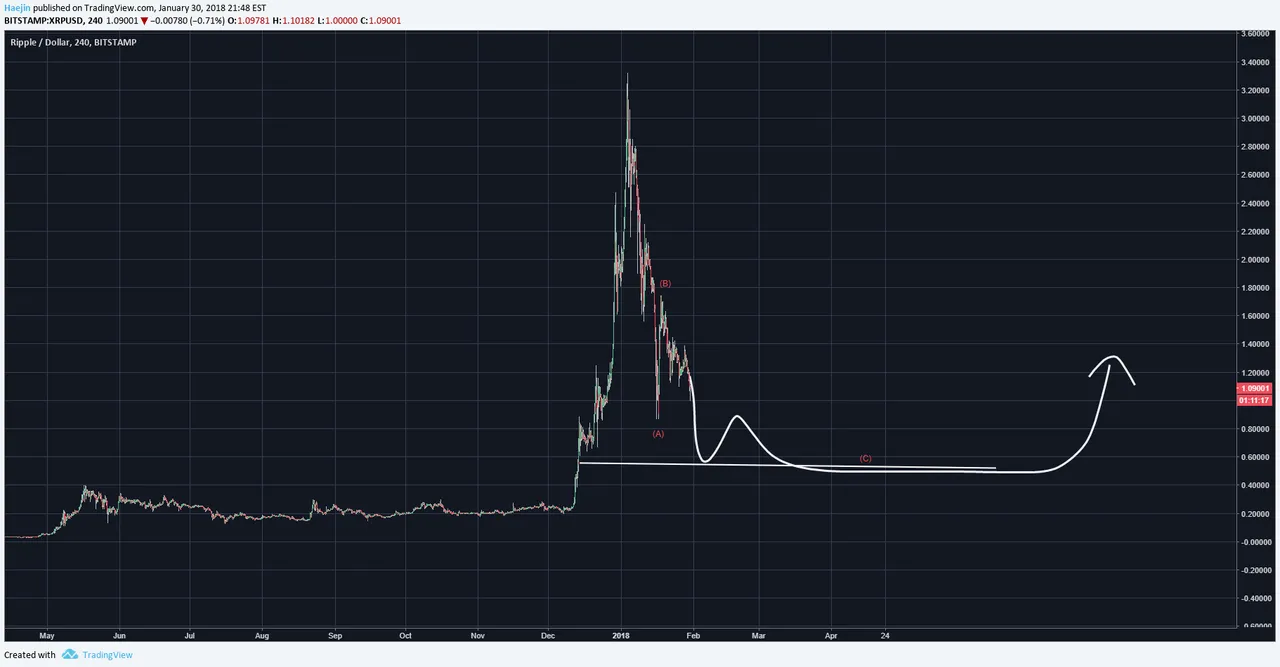
Even if that lower low occurs, it may not necessarily signal the END of a correction as price could still just scrape that bottom for a while to come. You can see exactly how that happened prior on the left side of below chart. The length of that sideways movement was quite extended laterally. The same could repeat because that's how most Alcoins correct. Could it be different this time? Could the abc down as shown in the above chart signal the bottom and prices promptly start going up? Yes, but possible and probable are not the same. It's difficult for people to change their personalities...no different for coins.
Legal Disclaimer: This is only my opinion, make of it what you wish. What does this mean? It means it's not advice nor recommendation to either buy or sell anything! It's only meant for use as informative or entertainment purposes.
Please consider reviewing these Tutorials on:
Elliott Wave Counting Tutorial #1
Elliott Wave Counting Tutorial #2
Elliott Wave Counting Tutorial #3
Laddering and Buy/Sell Setups.
Laddering Example with EOS
Tutorial on the use of Fibonacci & Elliott Waves
@haejin's Trading Nuggets
Essay: Is Technical Analysis a Quantum Event?
Follow me on Twitter for Real Time Alerts!!
Follow me on StockTwits for UpDates!!
--
--

If this blog post has entertained or helped you to profit, please follow, upvote, resteem and/or consider buying me a beer:
BTC Wallet - 1HMFpq4tC7a2acpjD45hCT4WqPNHXcqpof
ETH Wallet - 0x1Ab87962dD59BBfFe33819772C950F0B38554030
LTC Wallet - LecCNCzkt4vjVq2i3bgYiebmr9GbYo6FQf
