
SUMMARY
Our Learned Witnesses who are very dedicated to taking Steemit to ever greater heights have presented both sides of argument as to how exactly to treat Steem Dollars (SBD) compared to Steem. I'm certain they will make the wisest decision for the benefit of us all.
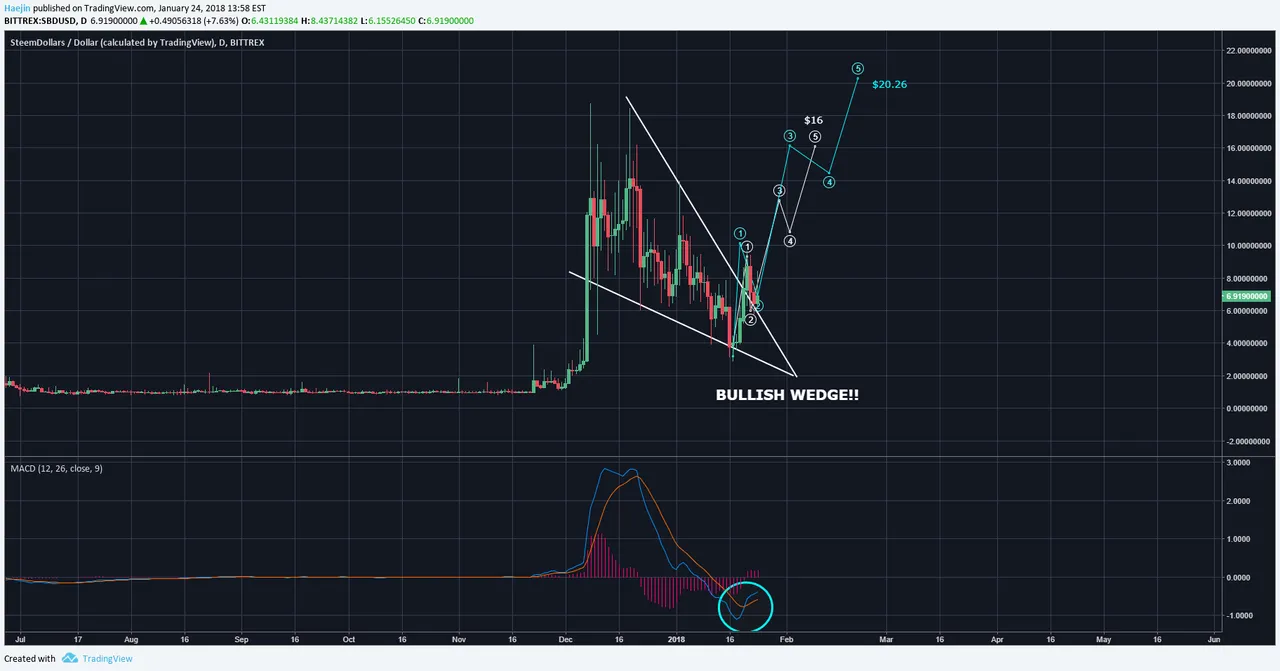
As a Technical Analyst, the chart for SBD is rather quite bullish. The Chart pattern below clearly displays a downward pointing wedge which is bullish. More so, price has broken out of the triangle and as MACD shows, price is expected to impulse upwards. As an Elliotician, I believe that price drives the news and events and never the reverse. While many find this difficult to accept; IF SO, then the impulse shows two levels of targets. The first scenario is that of $16 and the second is that of $20.26 or so. The MACD is also seems to be lifting itself up from the floor. Is it possible for the price go to a lower low? Yes, but to me, possible is very different from probable.
Legal Disclaimer: This is only my opinion, make of it what you wish. What does this mean? It means it's not advice nor recommendation to either buy or sell anything! It's only meant for use as informative or entertainment purposes.
Please consider reviewing these Tutorials on:
Elliott Wave Counting Tutorial #1
Elliott Wave Counting Tutorial #2
Elliott Wave Counting Tutorial #3
Laddering and Buy/Sell Setups.
Laddering Example with EOS
Tutorial on the use of Fibonacci & Elliott Waves
These Technical Analysis Books: Elliott Wave Priniciple & Technical Analysis of Stock Trends are highly recommended
@haejin's Trading Nuggets
Essay: Is Technical Analysis a Quantum Event?
Follow me on Twitter for Real Time Alerts!!
Follow me on StockTwits for UpDates!!
--
--

If this blog post has entertained or helped you to profit, please follow, upvote, resteem and/or consider buying me a beer:
BTC Wallet - 1HMFpq4tC7a2acpjD45hCT4WqPNHXcqpof
ETH Wallet - 0x1Ab87962dD59BBfFe33819772C950F0B38554030
LTC Wallet - LecCNCzkt4vjVq2i3bgYiebmr9GbYo6FQf
