Sbd-Usd prices are different on many exchanges but i tried to gather and used the most closely accurate chart we can have.
Let's have a look
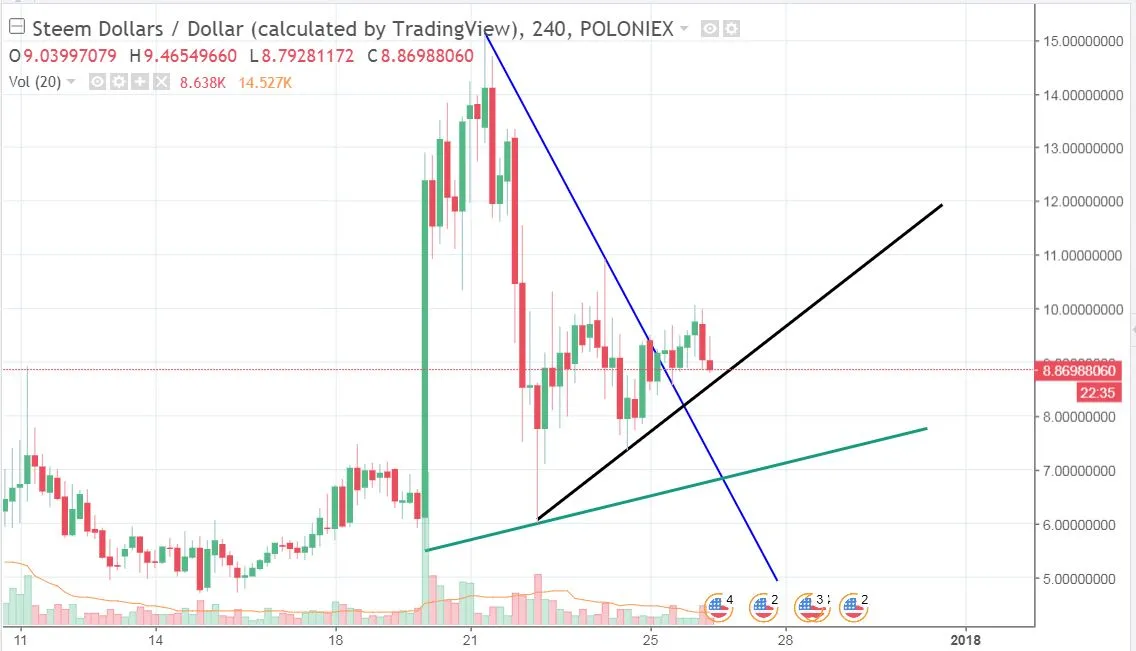
Current price is almost 9$+
Above shown is the 4 Hours chart.
First looking at the Blue trendline, it can easily be seen that the market has broken the short term resistance and no other trendline is still formed.
Secondly moving on to the green line, it's the long term trend line acting as support for current market.
And lastly the black line which the market is testing currently the break below this line may take the market to the green major support trendline,
Let's have a closer look to the black line.
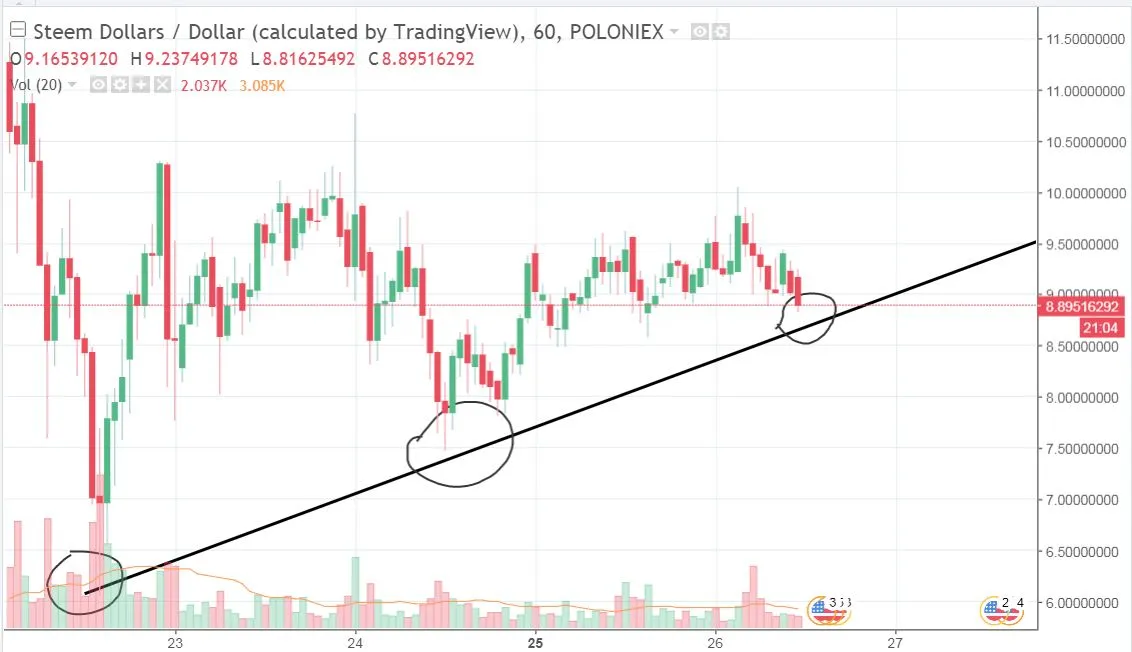
As seen in the above picture, closer look of black line on hourly timeframe.
If the market break and closes below this trendline the next support levels are 7.5 and 6$
If market stays above this line and bounce back after testing then 11$ is the next resistance.
Still overall we have a bullish Picture Due to Break of that Blue Trend Line.
Please note that the values mentioned on this chart differs from values on some exchanges.
Have a nice day and Thanks for Reading, Please hit Upvote button