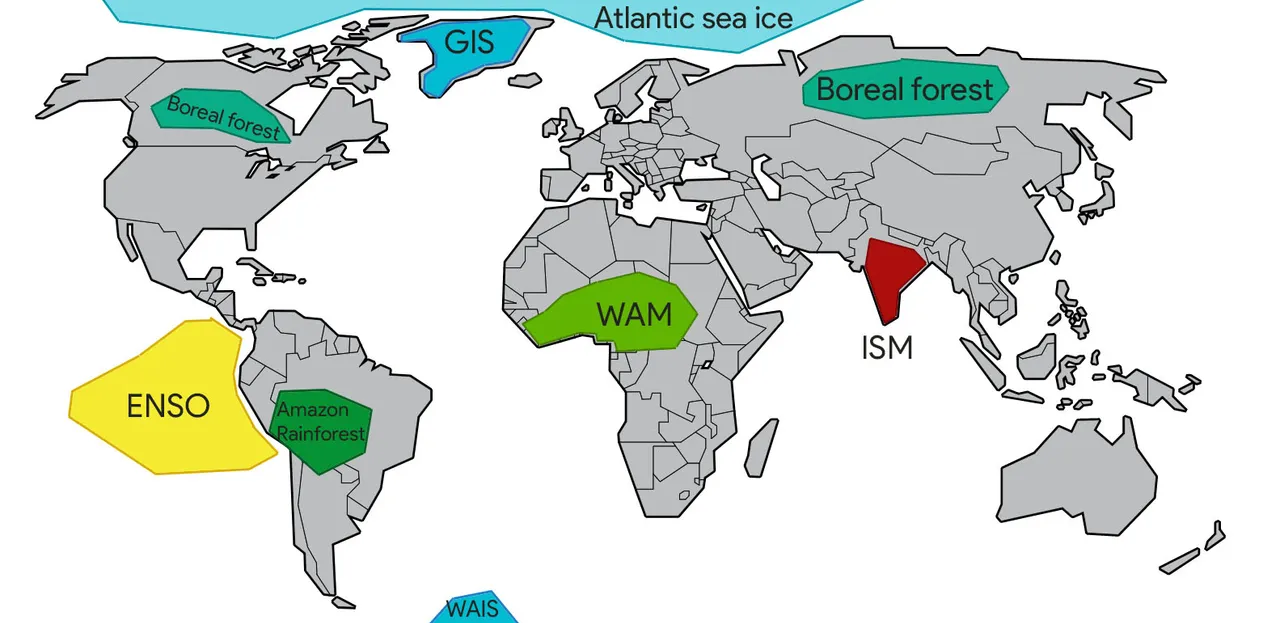
The earth's climate is full of balances that developed over time. But balances can be altered and some are characterized by a tipping point. This tipping point is a critical threshold at which a balance can be permanently tipped over and change after the threshold occurs faster than the cause could induce. Even when the forcing that pushed the scales is removed, a tipped balance can no longer reach its former equilibrium. Therefor such tipping points should be of everyone's interest since changes are often irreversible. An example of such a tipping point is the melting of the Greenland ice sheet. It is estimated that an increase of 2 to 4 degrees Celsius would cause a positive feedback loop resulting in the melt of the entire ice sheet. I would like to share some of the relevant tipping points that are affected by human forcing, and point out how much/little we know about it, or what the implications would be of a tipped balance in the next 100 years. It's quite a long article, so pick a few tipping points you are interested in or go through them all if you are really interested.
Greenland Ice Sheet or GIS
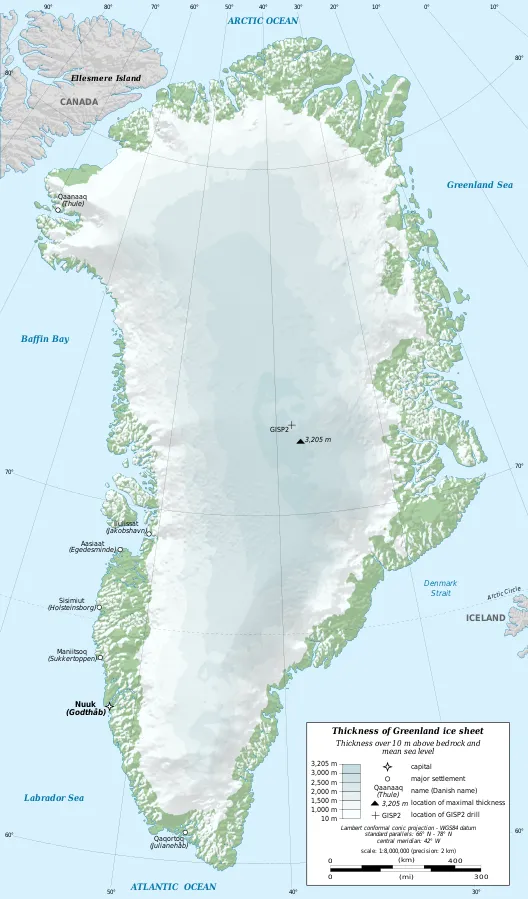
Map by Eric Gaba, published under CC BY-SA 3.0
I'll start with the, to my opinion, most commonly known tipping point. The GIS is a remnant of the many glacial periods and ice would be present for as long as 18 million years. To put this in perspective, this is slightly older than the first occurrence of great apes/hominids such as the bonobo, gorilla or chimpanzee. The ice sheet lies at a great height (approx. 2100 m/7000 ft) and since temperature decreases the higher you go, this allowed the greenland to maintain its ice during warmer periods that do not necessarily sustain an ice sheet. Since the end of the last ice age about 11.000 years ago, this is again the case. current climate does not support ice on Greenland but it is the height that keeps it stable. The danger here lies that a warming to a certain threshold melts the ice to a certain height, after which it can no longer sustain itself and melts completely. An estimated 2 to 4°C warming is needed to pass this tipping point. Inland glaciers in higher mountains could remain but the majority of the overland ice sheet would melt in a time span of thousand years or more.
When this happens, and all melt water is released in the sea, it will contribute to a sea-level rise of 7 meters over the next millennium. The bedrock underneath the GIS has been pushed below the sea level due to weight of the ice, except for the mountains along the edges. If the ice would melt, Greenland would most likely turn into an archipelago until isostatic rebound lifts the surface above sea level again. This is also what is happening to the Baltic region, which was also covered with an ice sheet in the last ice age.
Arctic Sea-Ice
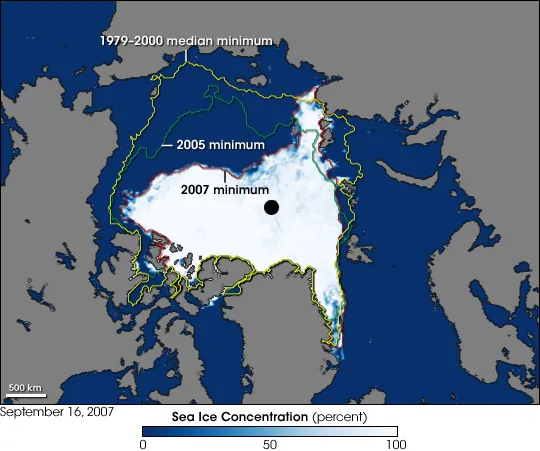
surrounding the Greenland Ice Sheet is about 12 million square kilometers or 4.6 million square miles of arctic sea-ice. The properties of the ice currently allow a lot of solar radiance to be reflected back into space (high albedo) and this is what could cause a feedback loop. When sea-ice melts it exposes a much darker ocean surface which absorbs the sun's energy rather than reflecting it. This in return increases temperature which again supports the melting of more sea-ice. Currently already a strong decline in sea-ice is measured and some suggest the tipping point has already been passed, but not everyone agrees to this. The International Panel on Climate Change (IPCC) ran several models regarding the arctic sea-ice for different emmission pathways. Half of the models became completely free of ice during the warmest period somewhere in this century, while only two simulations predict complete loss of sea-ice under extreme conditions. A clear critical threshold has not yet been defined. The models of the IPCC are also met with a lot of uncertainty but significant change is very well possible during this century.
West Antarctic Ice Sheet or WAIS
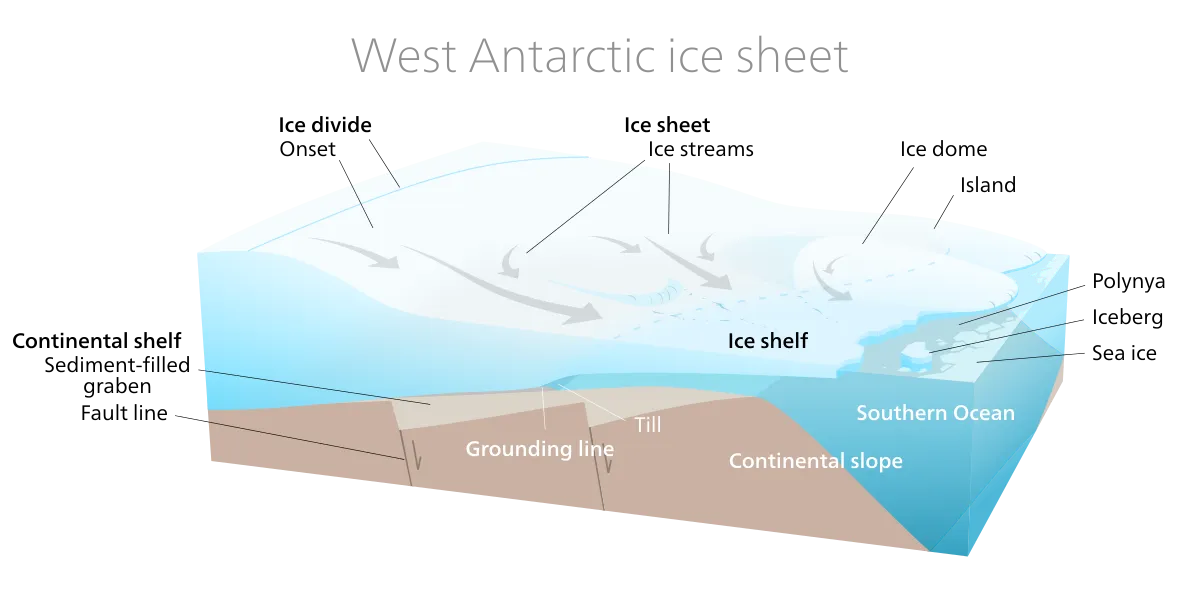
Illustration by Kelvinsong licensed under CC BY-SA 3.0
While we are at it I will continue with the other major ice sheet on this planet, Antarctica. In general, Antarctica is considered stable. It is completely surrounded by ocean water which isolate it from warm water or air flows. This is also why the Antarctic sea-ice is in less danger. In the last decades only little warming has been observed. There is however one potential point that can collapse. The West Antarctic Ice Sheet lies on bedrock that has sunk below sea level and slopes land inwards. If the ice retreats only a little, ocean water may undercut the ice sheet which strongly induces further calving of ice shelves. It would require a local warming of about 5°C for summer temperatures to exceed the melting point. Since colder regions are influenced more by a global temperature rise it is possible that this 5°C is already reached with a global increase of only a few degrees. Currently the WAIS is losing mass and glaciers are losing 60% more ice mass than they gain from snowfall. The IPCC does not propose an exact threshold but some expect that the tipping point might be reached in this century. Also the timescale of the consequences is yet highly uncertain but in a worse case scenario, where the ice sheet collapses in 300 years, sea-level would rise by 1 meter per century.
A new study, published only two weeks ago, assessed the four decades of antarctic ice sheet mass balance from 1979 until 2017. Surprisingly they concluded that other glaciers are prone to ice loss as well.
Atlantic Thermohaline Circulation or THC
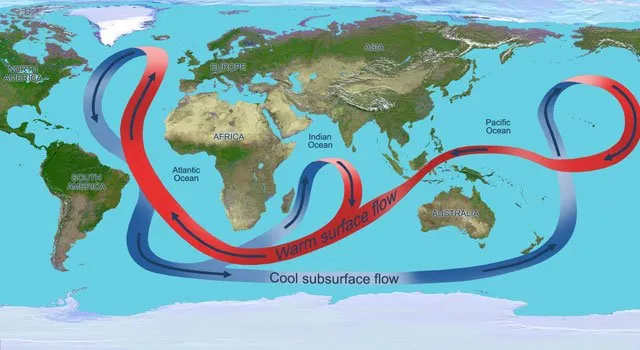
Image by NASA/JPL
Ok, this will be the last tipping point regarding ice or melting, I promise. The THC is the waterflow that distributes warm water to the poles, and cold water back to the equator. This flow of water is largely driven by differences in density, temperature and salt content. But when a significant amount of freshwater gets released near the Atlantic, this density driven water current might be halted. Almost all models show a collapse of the circulation and in some this is still reversible after forcing is removed. But how sensitive this circulation is, is poorly studied. However, the IPCC summarizes that a sudden collapse of the THC is 'very unlikely' in the following century but a transition is 'likely' after that.
El Nino-Southern Oscillation or ENSO
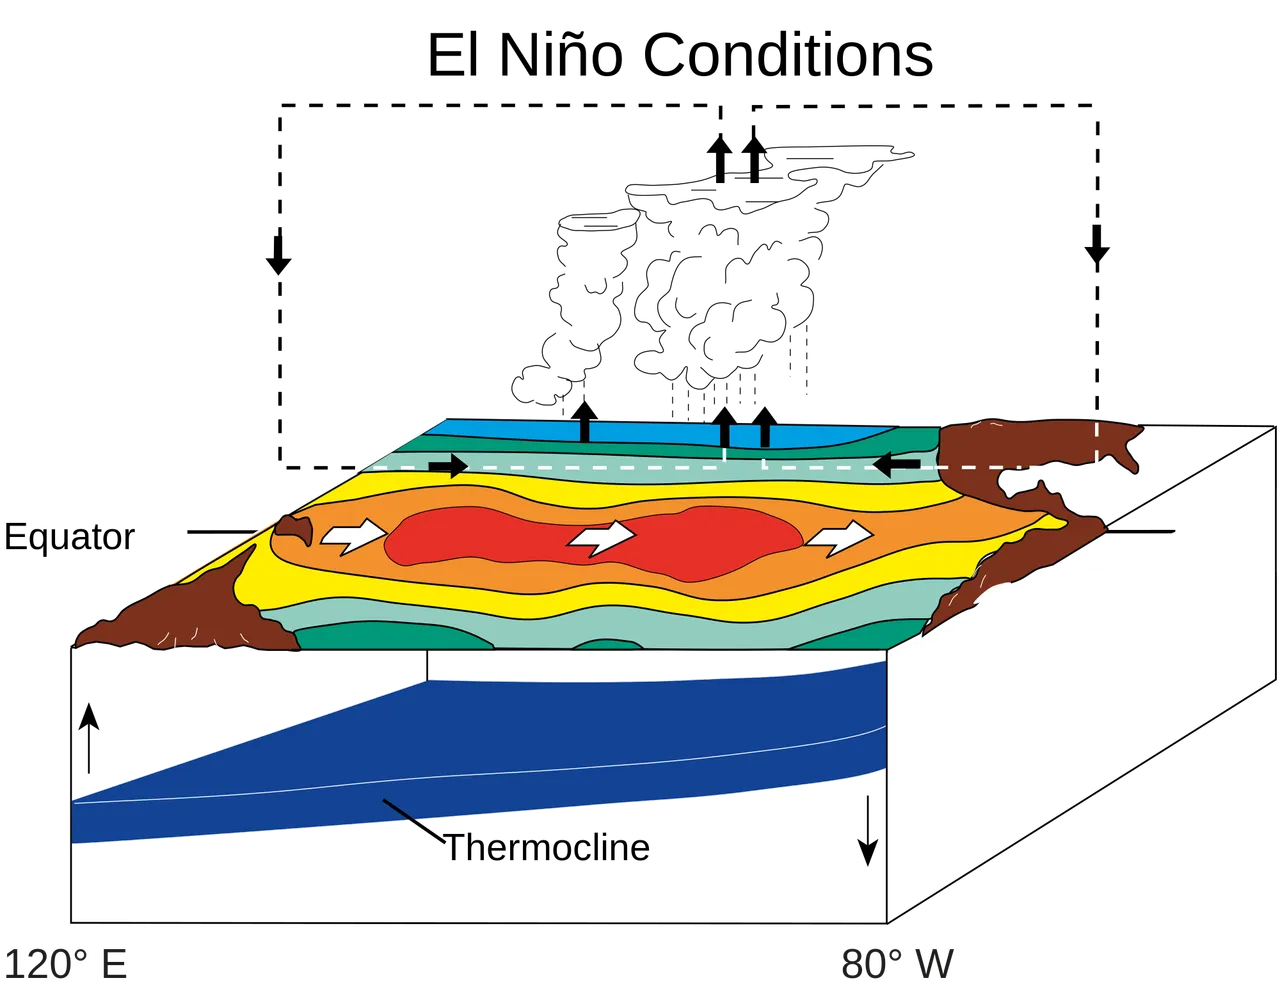
the occurrence of ENSO relies on three elements. The depth of the thermocline in ocean water, the slope of the thermocline and finally the temperature gradient across the equator. When the oceans take up more heat, this can push the thermocline to larger depths, inducing more intense and/or more frequent ENSO. But on the opposite is it expected that easterly winds become more intense which would force more cold water to the surface, reducing the intensity and/or frequency of the ENSO. However, most models predict a shift to a more intense ENSO with similar frequency as today but the probability of these statements are still highly uncertain.
Amazon Rainforest
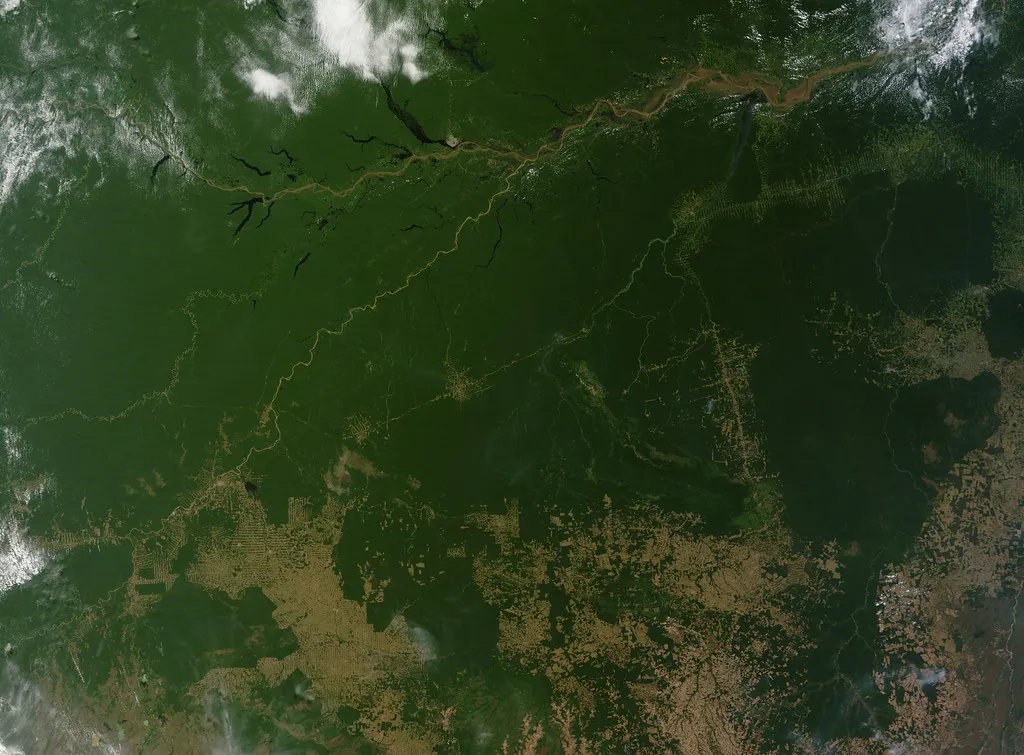
The amazon rainforest induces a lot of evaporation and transpiration, which again induces more rain on the continent. Because of this, precipitation measures are higher than they would normally without vegetation. About 20 to 30% of the precipitation originates from this effect. In another way, it is the evapotranspiration that allows to maintain high precipitation and thus the rainforest itself. If however, land use changes significantly, we might reduce the recycled precipitation to a point where the rainforest can no longer sustain itself. Again, no threshold has been stated for this feedback loop.
Boreal Forest
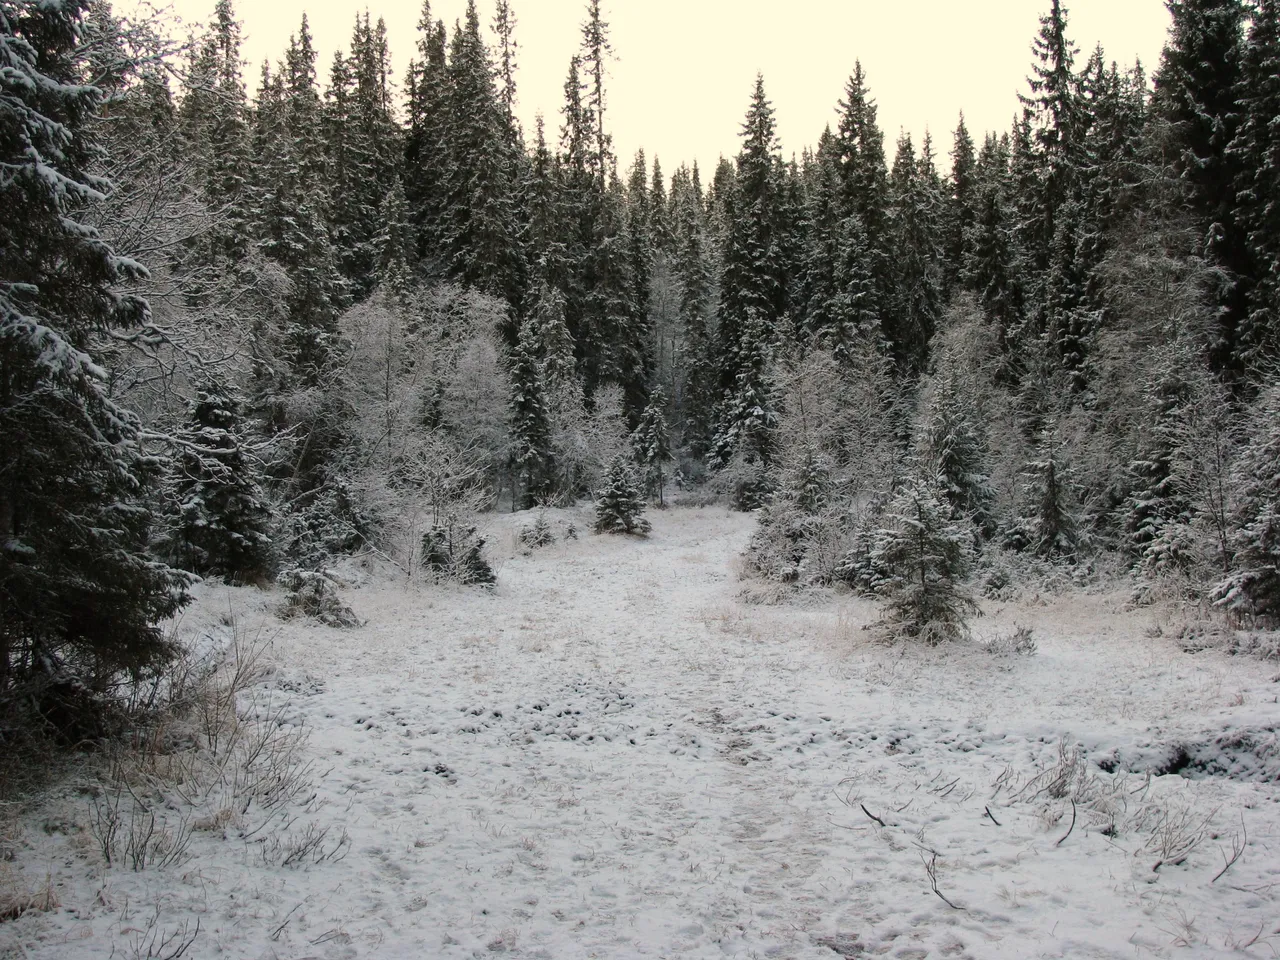
under further rise of global temperatures, large-scale withdrawal of boreal forest is expected. increasing temperatures will lead to increased water stress, higher peak temperatures during summer and increased vulnerability to fire and disease. Yet, temperate tree species are not able to immigrate since winter temperatures remain too cold. This would result in a decrease of forest and an increase in open woodlands or grasslands. This threshold is estimated at around 3°C of global warming but due to limitations in the models and understanding of the phenomenon, uncertainty is high.
Indian Summer Monsoon or ISM
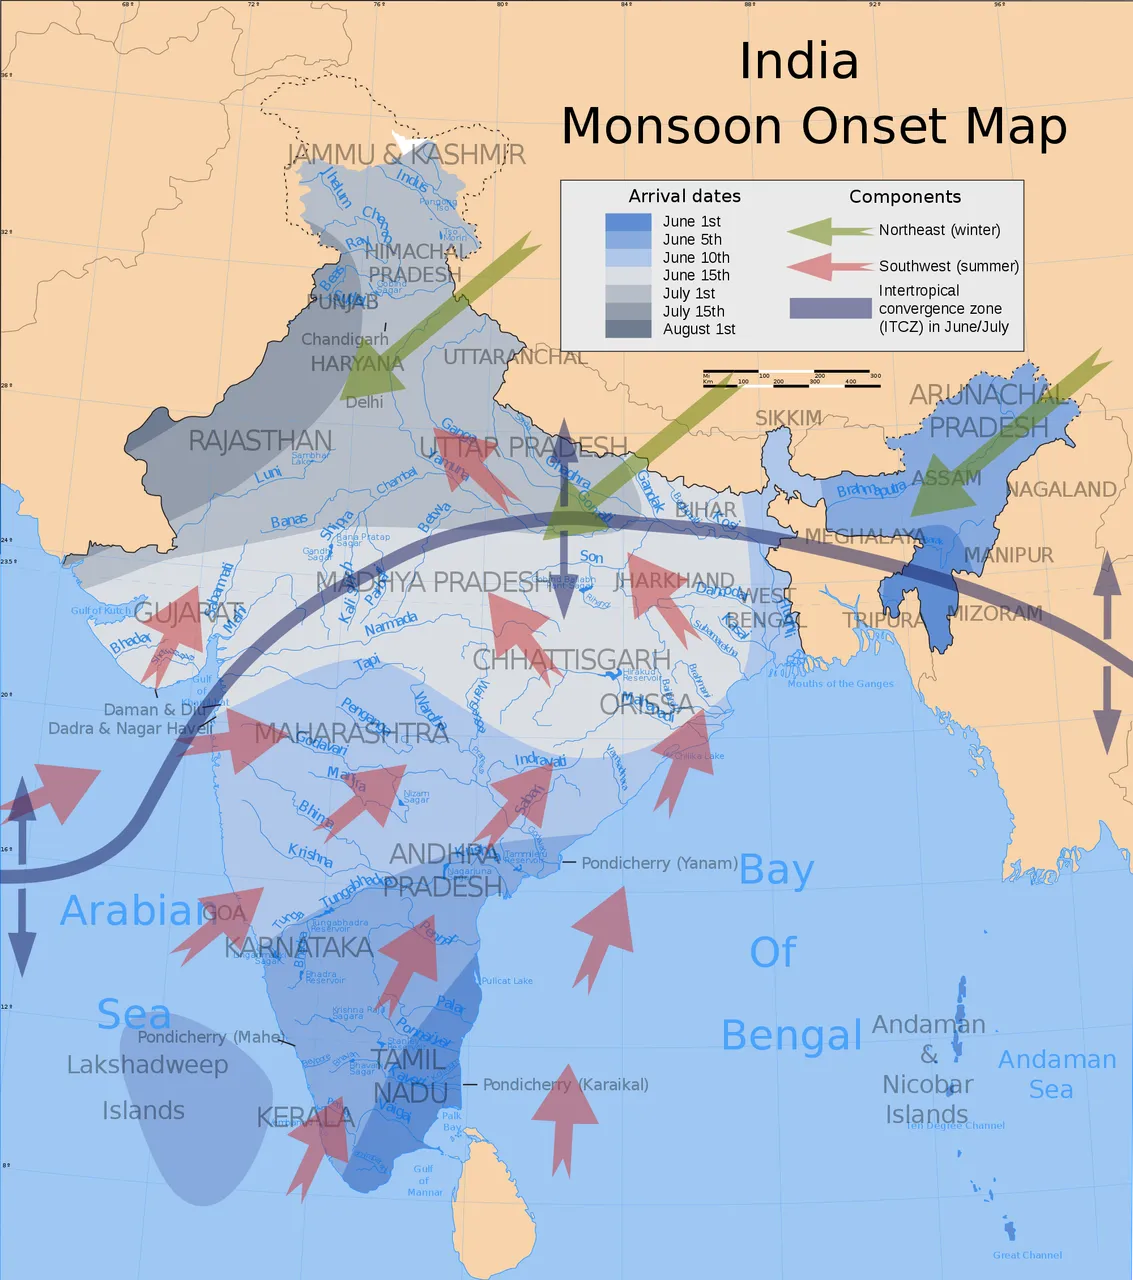
Illustration from Saravask shared under CC BY-SA 3.0
Monsoon circulation is driven by the pressure gradient between the atmosphere above the land and the ocean. any forcings that weakens this pressure gradient can potentially destabilize the circulation. Atmospheric warming tends to be stronger over land and thus can strengthen the monsoon, but increased albedo over land due to land cover changes tend to reduce warming over land.
Models predict that the regional albedo needs to exceed 0.5 for the ISM to collapse, which is similar to the albedo of snow and clouds. Even then would increasing CO2 concentrations stabilize the monsoon. IPCC projections also do not show a threshold and conclude that there is no direct danger. They do however acknowledge that additional aerosols in the atmosphere from air pollution might additionally weaken the ISM.
West African Monsoon or WAM
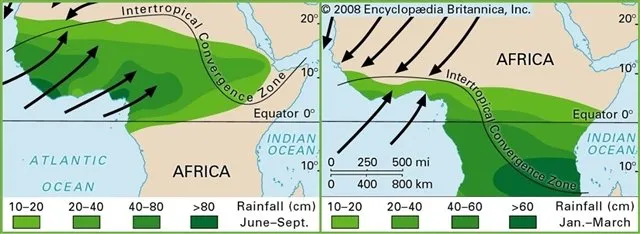
Illustration from Encyclopædia Britannica, Inc.
The Sahara and Sahel region are only fairly recent transformed to a desert. Until about 5000 years ago, vegetation was still present in the Sahara. The circulation that could bring precipitation to this region (WAM) is affected by sea surface temperature differences between the two hemispheres. Greenhouse gasses are expected to further increase these temperature differences and thereby increasing rainfall. Three models were designed but in both models the WAM actually collapses. In one of the models this leads to a further drying of the Sahel but in the second model, this collapse leads to increased precipitation. For this model to become true, a regional warming of 3°C is required in the Gulf of Guinea. and finally the third model predicts no major trends in amount of precipitation, but it predicts more intense dry years.
What is also observed in the Sahel nowadays is the greening of shrub vegetation. The increase in CO2 content of the atmosphere allows plants to absorb CO2 more efficiently while losing less water. This greening trend in the Sahel, and the WAM models are a rare example of a beneficial tipping element. You can find more about the three models here.
Conclusion
It still amazes me how much uncertainty there is about such large scale tipping points that have such effects in the near future. Maybe more awareness and knowledge about these permanent implications can further influence policy makers or just inspire people to take more actions bottom up.
Thanks for reading, I hope you found my work interesting! If you have any comments, please don't hesitate to leave them behind!
All images that were not attributed are in public domain. If you like to discover new scientific content, definitely check out new articles with the #steemstem tag from @steemstem.
Sources
Cook, K. H., & Vizy, E. K. (2006). Coupled model simulations of the West African monsoon system: Twentieth- and twenty-first-century simulations. Journal of Climate, 19(15), 3681–3703. https://doi.org/10.1175/JCLI3814.1
Gregory, J. M. (2004). Threatened loss of the Greenland Ice-sheet. Nature, 428, 616.
Hanna, E., Navarro, F. J., Pattyn, F., Domingues, C. M., Fettweis, X., Ivins, E. R., … Jay Zwally, H. (2013). Ice-sheet mass balance and climate change. Nature, 498(7452), 51–59. https://doi.org/10.1038/nature12238
Rignot, E., Mouginot, J., Scheuchl, B., van den Broeke, M. R., van Wessem, M. J., & Morlighem, M. (2019). Four decades of Antarctic Ice Sheet mass balance from 1979-2017. Proceedings of the National Academy of Sciences, 1–9. https://doi.org/10.1073/pnas.1812883116
Schellnhuber, H. J. (2009). Tipping elements in the Earth System. Proceedings of the National Academy of Sciences, 106(49), 20561–20563. https://doi.org/10.1073/pnas.0911106106
https://phys.org/news/2018-03-amazon-deforestation.html
https://globalforestatlas.yale.edu/climate-change/climate-change-boreal-forests
http://nsidc.org/arcticseaicenews/
https://en.wikipedia.org/wiki/El_Ni%C3%B1o%E2%80%93Southern_Oscillation