Technical Analysis:
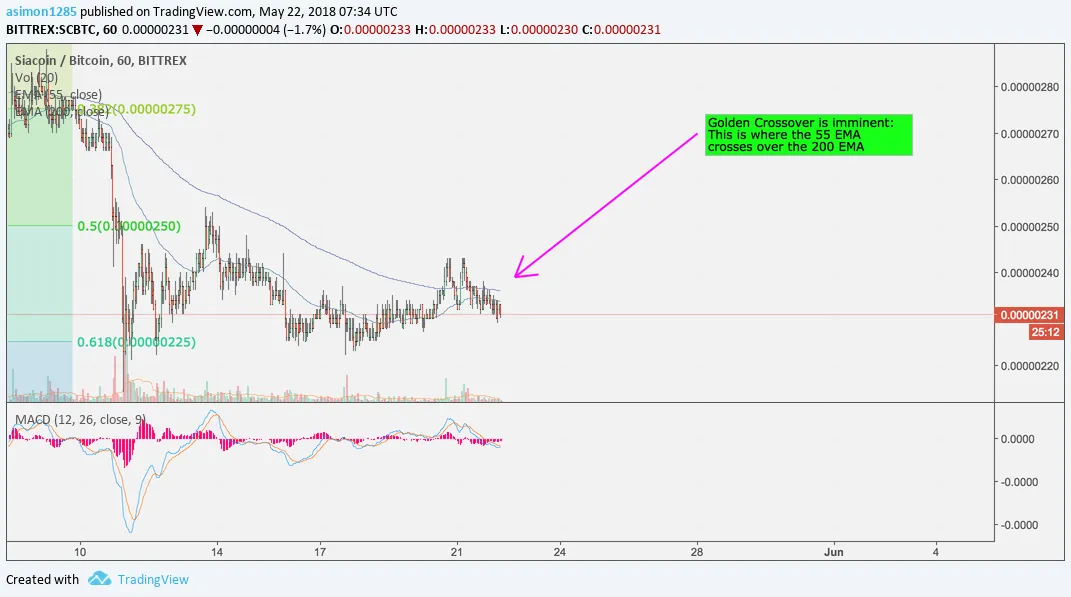
- SIA has already retraced to the .618 Fib level making it an attractive buy at these lower prices: 200-230 satoshi
- On the 1 hour chart - a Golden Crossover looks to be imminent
- This is when the 55 EMA crosses over the 200 EMA
- The last time this happened SIA ran up from 125 satoshi to 325 saotshi
- Tron TRX/BTC just had a Golden Crossover on Friday May 18, 2018, on the 1 hour chart, and it ran up from 830-988 satoshi
- Support/stop-loss between 200-220 satoshi
- Look for the golden crossover to happen as confirmation for a run up
- Initial sell targets at 250 satoshi and 270 satoshi
If you have found this helpful, please UPVOTE, FOLLOW, and RESTEEM :0)
Any and all donations are much appreciated and will allow me to continue producing free analysis! Let me know what charts and analysis you are interested in and I will be happy to work on them!
- LITECOIN: MNwqCX6HoU6MeU9SRwNakT3iHEkfrig2YB
- BITCOIN: 3MwvZ6Q7R7dtSR8P1o5bb3oz4hegwtSuiR
- BINANCE: 0xcaf1e0cd3de21a7d27497a95f8196f74a073ad76
- ETHEREUM: 0x4c8d59799E6EF1faE64Bc40D1668B77DD8d5e9Ed
START INVESTING TODAY!
CLICK HERE TO SET UP AN ACCOUNT ON COINBASE
LEGAL DISCLAIMER:
I am not a financial advisor, nor is this intended to be financial advise. I encourage you to do your own research considering this blog is a way for me to document my own personal analysis, charts, trading decisions, and experiences. If you would like to learn more about trading, cryptocurrencies, and the resources I used to learn how to trade and invest, see my previous post - LINK.