Despite so many worrying about the trade wars, and now Turkey, we still believe there is much more upside to the equity market before we see the 20-30% correction we expect in 2019. But, for now, we are trying to focus on from where we begin the next melt-up phase in the equity markets and whether we will top out at the lower end of our target zone in the 3011 region or be able to extend to our ideal target in the 3225SPX region.
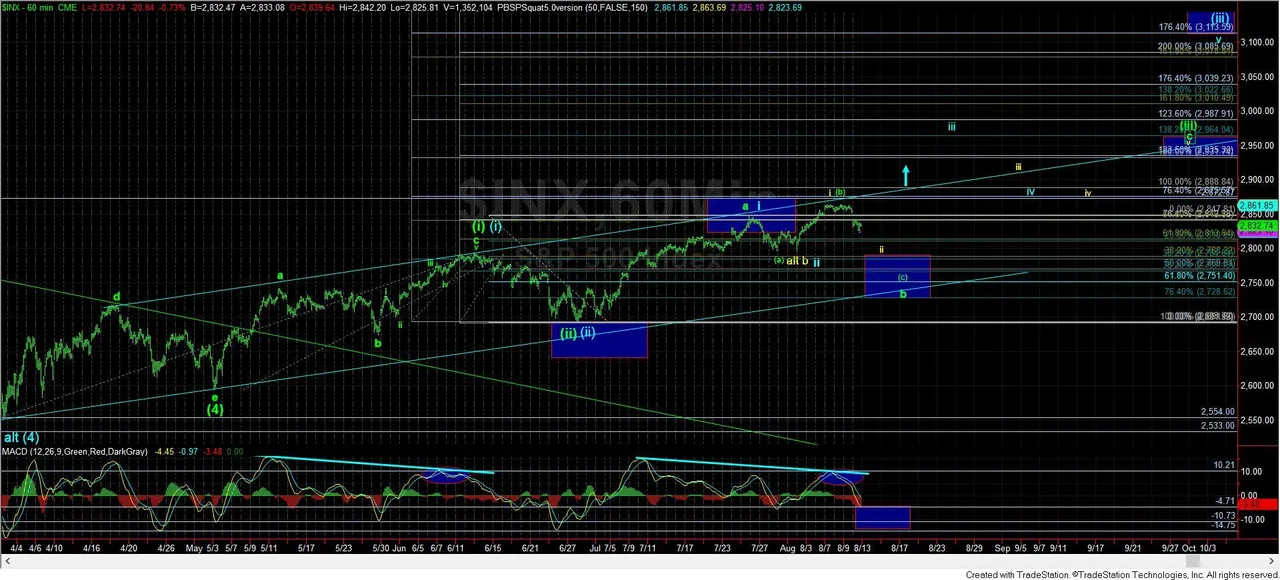
With the market pushing a bit higher than I had wanted to see over the past week, it has added a certain amount of further complexity, which can still allow the SPX to attack the 3225SPX region into 2019. So, allow me to go through the various perspectives I have laid out on the chart. But, first, I want to note that the patterns I am tracking on the 60-minute chart are all with the proviso that we maintain over 2730SPX on this pullback we began at the end of last week.
Now, with that in mind, allow me to highlight my preference, which is highlighted in green. Within this structure, the market “should” drop down to at least the 2790SPX region next week, but, more preferably to the 2750-2770SPX region in a (c) wave of the green b-wave. And, that b-wave is within wave (iii) of an ending diagonal in the SPX, which will not likely extend beyond the 3011 region later this year.
The more advanced pattern of that wave (iii) in the ending diagonal is presented in yellow, which would suggest that this pullback is one degree ahead of the green count. That means that the b-wave has already completed, and this pullback is wave ii of the c-wave in wave (iii). This is probably my least favorite potential for the reasons I noted earlier this week.
For both these potentials, my target for wave (iii) is 2935-2965SPX. And, an impulsive move through 2854SPX would suggest we have begun that run to our next higher target.
Due to the higher move we experienced early this past week, I have to now consider the more bullish pattern to 3225SPX a little more seriously. I have labeled that pattern in blue, and it is an alternative pattern at this time. This pattern has a leading diagonal for wave (i) completed off the early April lows, and has us now setting up for the heart of a 3rd wave, ultimately pointing us over 3100SPX for wave (iii). However, in order to prove this is the operative count for wave (5), we will need to see a strong break out through 2890SPX in the coming week or two. Should this occur, then we will likely see a pullback to the 2870SPX region, and as long as we hold the 2840SPX region on that pullback, it will be pointing us up towards the 3100 region in quick fashion to complete wave (iii) of wave (5).
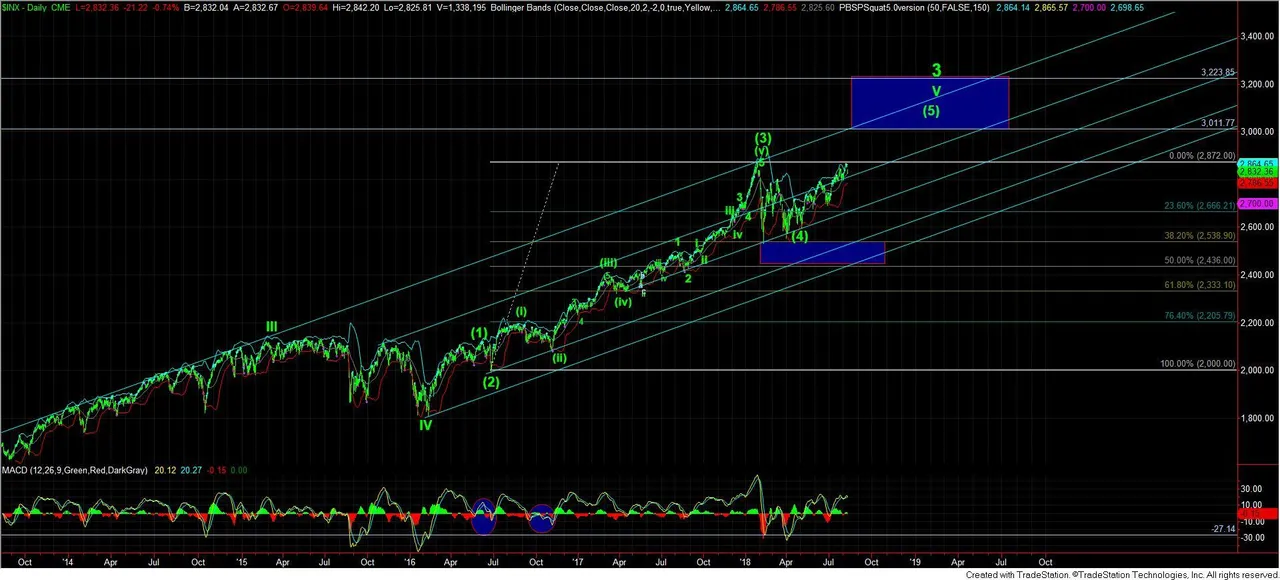
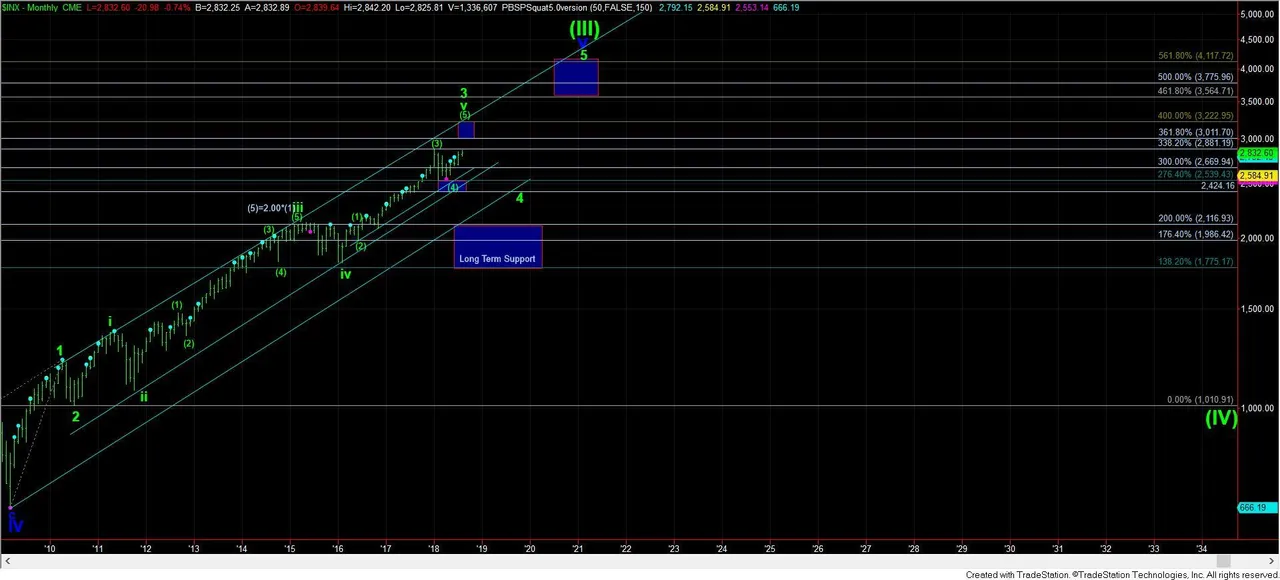
Again, I want to reiterate that we have had to deal with all this additional complication in 2018 simply because the wave (4) did not provide us with a clear 5-wave c-wave completion. This has allowed for two possibilities as to where wave (4) ended and where wave (5) began. The lower level for wave (4) allows for the more bullish structure pointing still to the 3225SPX ideal target we set quite some time ago for wave (5) of v of 3, whereas the triangle structure which completed in early May would suggest that we may not exceed the lower end of our target zone for wave (5) of v of 3 in the 3011 region.
However, I think we will finally be able to distinguish between the two major potentials within the next two weeks. Ultimately, I still think the market has some upside left to it before we get the 20-30% correction I expect in 2019.