Chart Overview (BTC/USDT, 4H Timeframe)
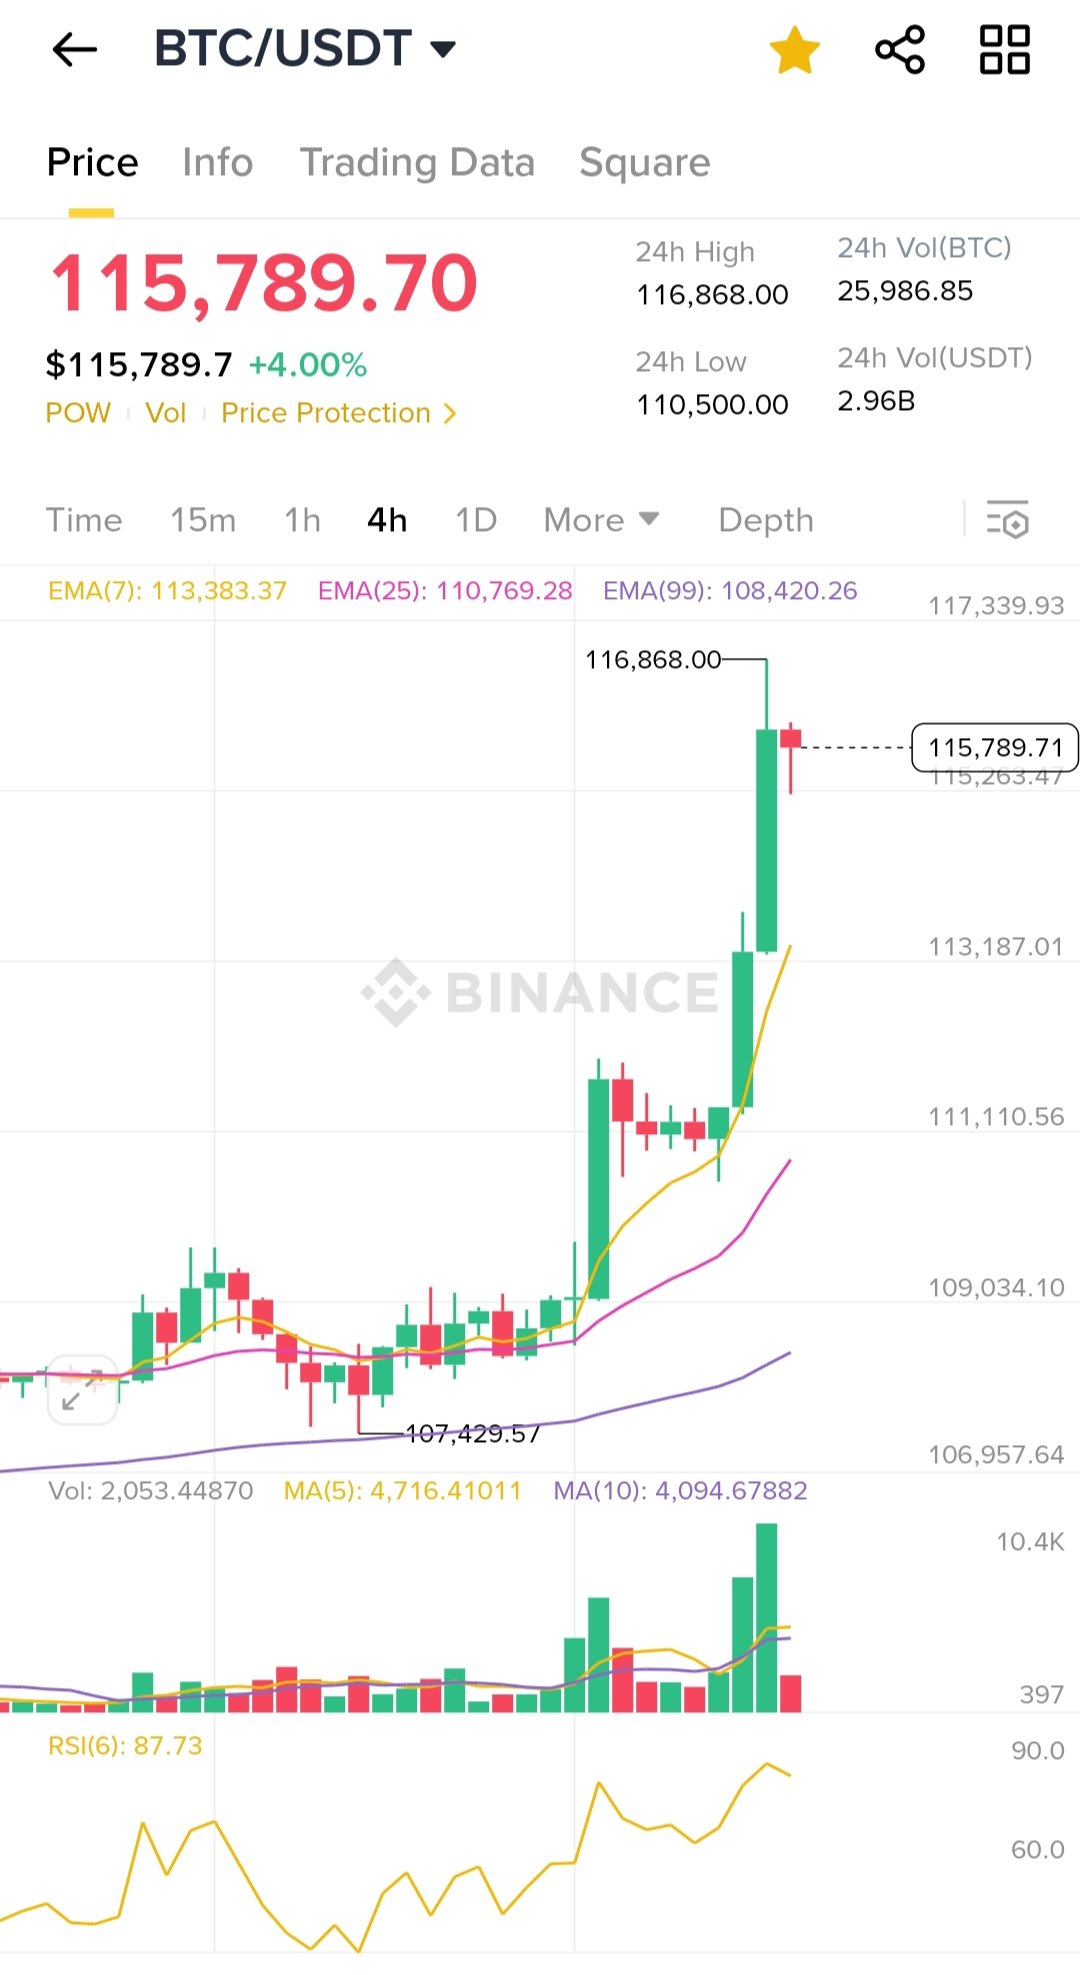
As of now, Bitcoin has surged to a new short-term all-time high (ATH) of $116,868, with the current price slightly retracing to $115,789.70, up +4.00% in 24 hours. Several technical indicators suggest strong bullish momentum:
Technical Analysis
1. Breakout Above Consolidation Zone
- BTC recently broke out from the $107,000–$111,000 consolidation zone.
- The breakout candle was long-bodied with high volume, confirming strong buyer participation.
2. Exponential Moving Averages (EMA)
- EMA(7): 113,383.37
- EMA(25): 110,769.28
- EMA(99): 108,420.26
Price is far above all key EMAs, suggesting a strong uptrend with widening gaps – a classic sign of bullish acceleration.
3. Volume Surge
- Volume spiked significantly during the breakout – clear confirmation of institutional or whale-driven interest.
- Volume bars show green dominance, meaning buyers are clearly in control.
4. RSI (Relative Strength Index)
- Current RSI(6): 87.73 → Extremely overbought territory.
- While this indicates strong momentum, it also suggests a short-term pullback or consolidation is likely soon.
5. Candlestick Pattern
- The last candle has a long upper wick after touching the ATH, indicating some profit-taking near the top.
Trigger for the New ATH
This spike could have been driven by:
- Macro events: Possibly dovish Fed tone, ETF inflows, or a weaker dollar.
- Technical breakout: Bulls were waiting for confirmation above $111,000.
- Short squeeze: Bears betting on lower prices got liquidated, adding fuel to the upward move.
Conclusion
Bitcoin has broken out to a new short-term ATH of $116,868, powered by strong volume and bullish momentum. However, with RSI in the overbought zone, short-term consolidation or minor correction is likely before the next leg up.