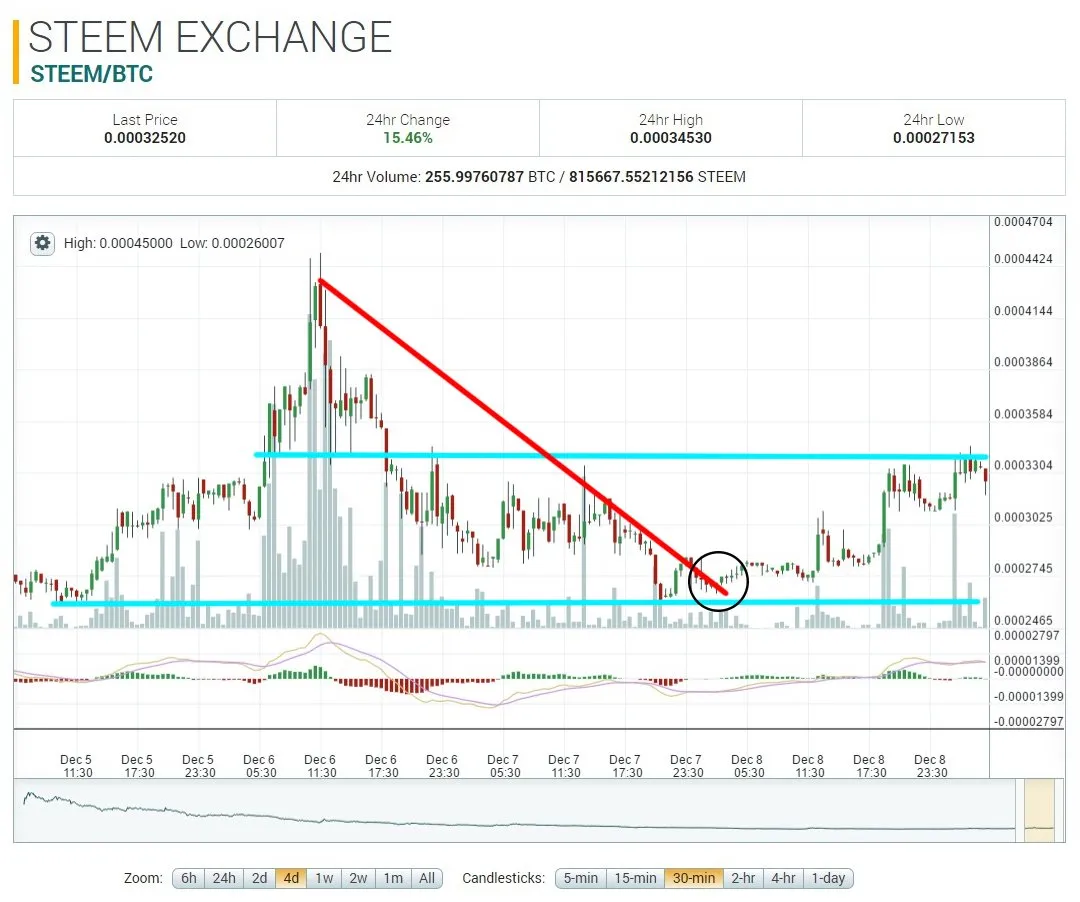
The STEEM price continues to hold the recent uptrend line, targeting $0.27 resistance.
In yesterday’s post, I mentioned that support at ~$0.20 was being tested. The short-term uptrend line for STEEM was converging with that support line and it was critical for the price to remain above it in order to prevent likely falling back to the $0.15 – $0.16 range. The support was confirmed once again and the price bounced off of it and has continued upward, to about $0.26. The price is currently over $0.24.
We can see on the 1-month chart that the trend line is up and with increasing velocity at intervals of about 5-7 days.
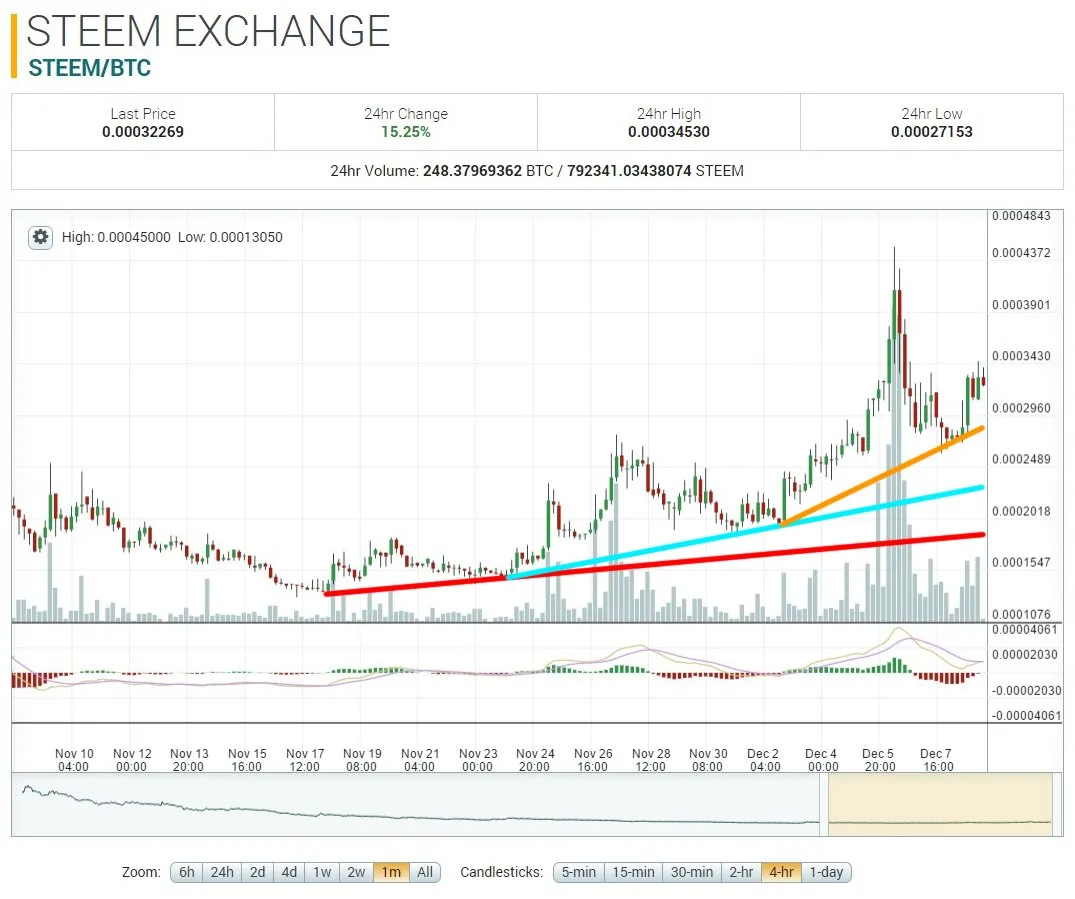
There was quite a jump in volume on December 6th and for now, it has remained well above where it was for most of November. Current volume is around $250,000. This is a good sign and if it can be maintained during this price rise that’s targeting $0.27 – or even grow again – it could be an indication that we’re not likely to see new lows for the time being.
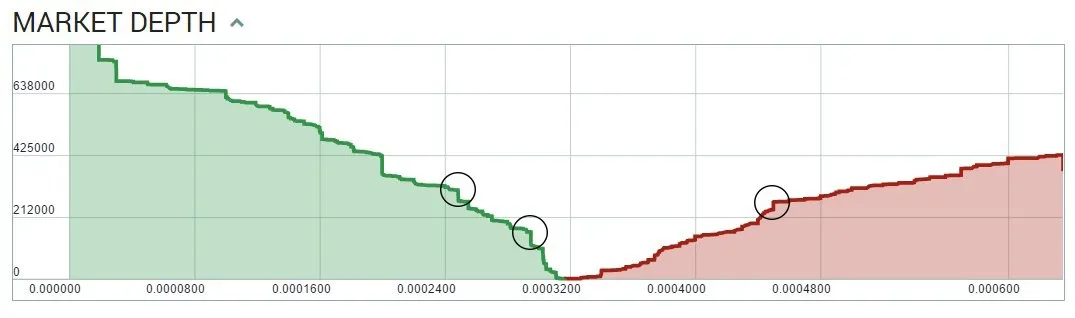
Buy orders are stacking up on the depth chart at $0.23 (just under $40,000 total) and around $0.20 (~$68,000 in total orders). Sell orders aren’t really significant until about $0.30 – $0.31, where the orders reach approximately $40,000, so there’s room for the price to go higher. Keep in mind that these are just existing orders and any additional sellers can come in at any time.
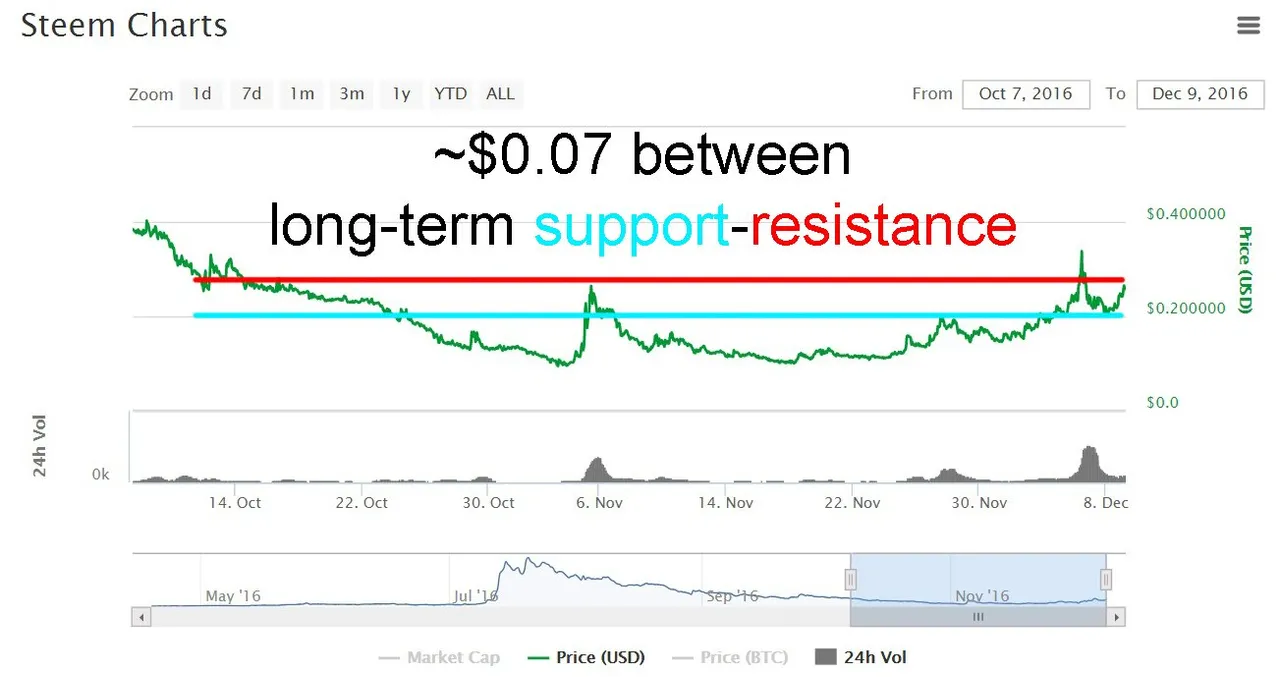
If we check the charts for STEEM’s support and resistance lines, we can see how close these lines are in a greater context. The moves may seem significant on a percentage basis, but we’re still talking about pennies. Regardless, the support and resistance lines matter. If the STEEM price can punch through $0.27 again on steady volume without another parabolic rise, then it will be looking pretty good for the first potential rounds of selling after the new power down schedules are completed next week.
Based on recent charts, it looks like STEEM is establishing a fairly good amount of short-term support at $0.23, but some resistance near $0.26/0.27. Breaking $0.23 will most likely send it back to $0.20 and it will also break the uptrend line, sending us a signal that prices may fall back to $0.15, as I mentioned earlier. Breaking through $0.27 to the upside will most likely send it to $0.30 or higher, possibly to the last local high at ~$0.34.
As always, keep an eye on the volume during these moves. Heavy volume during a price move that breaks well-established support-resistance lines will tell you where the market wants to go. Don’t stand in its way. If volume is light or unchanged, there’s not much meat behind it and you should be cautious if you’re trying to trade the move.
Disclaimer: I am not a professional advisor and this info should not be used for trading. I would be flattered that you think so highly of my fairly basic analysis, but it would not be prudent to use this for transacting with real money.
*Charts are from coinmarketcap.com and poloniex. Data is current as of 12:30am EST, December 9th, 2016.
Follow me: @ats-david