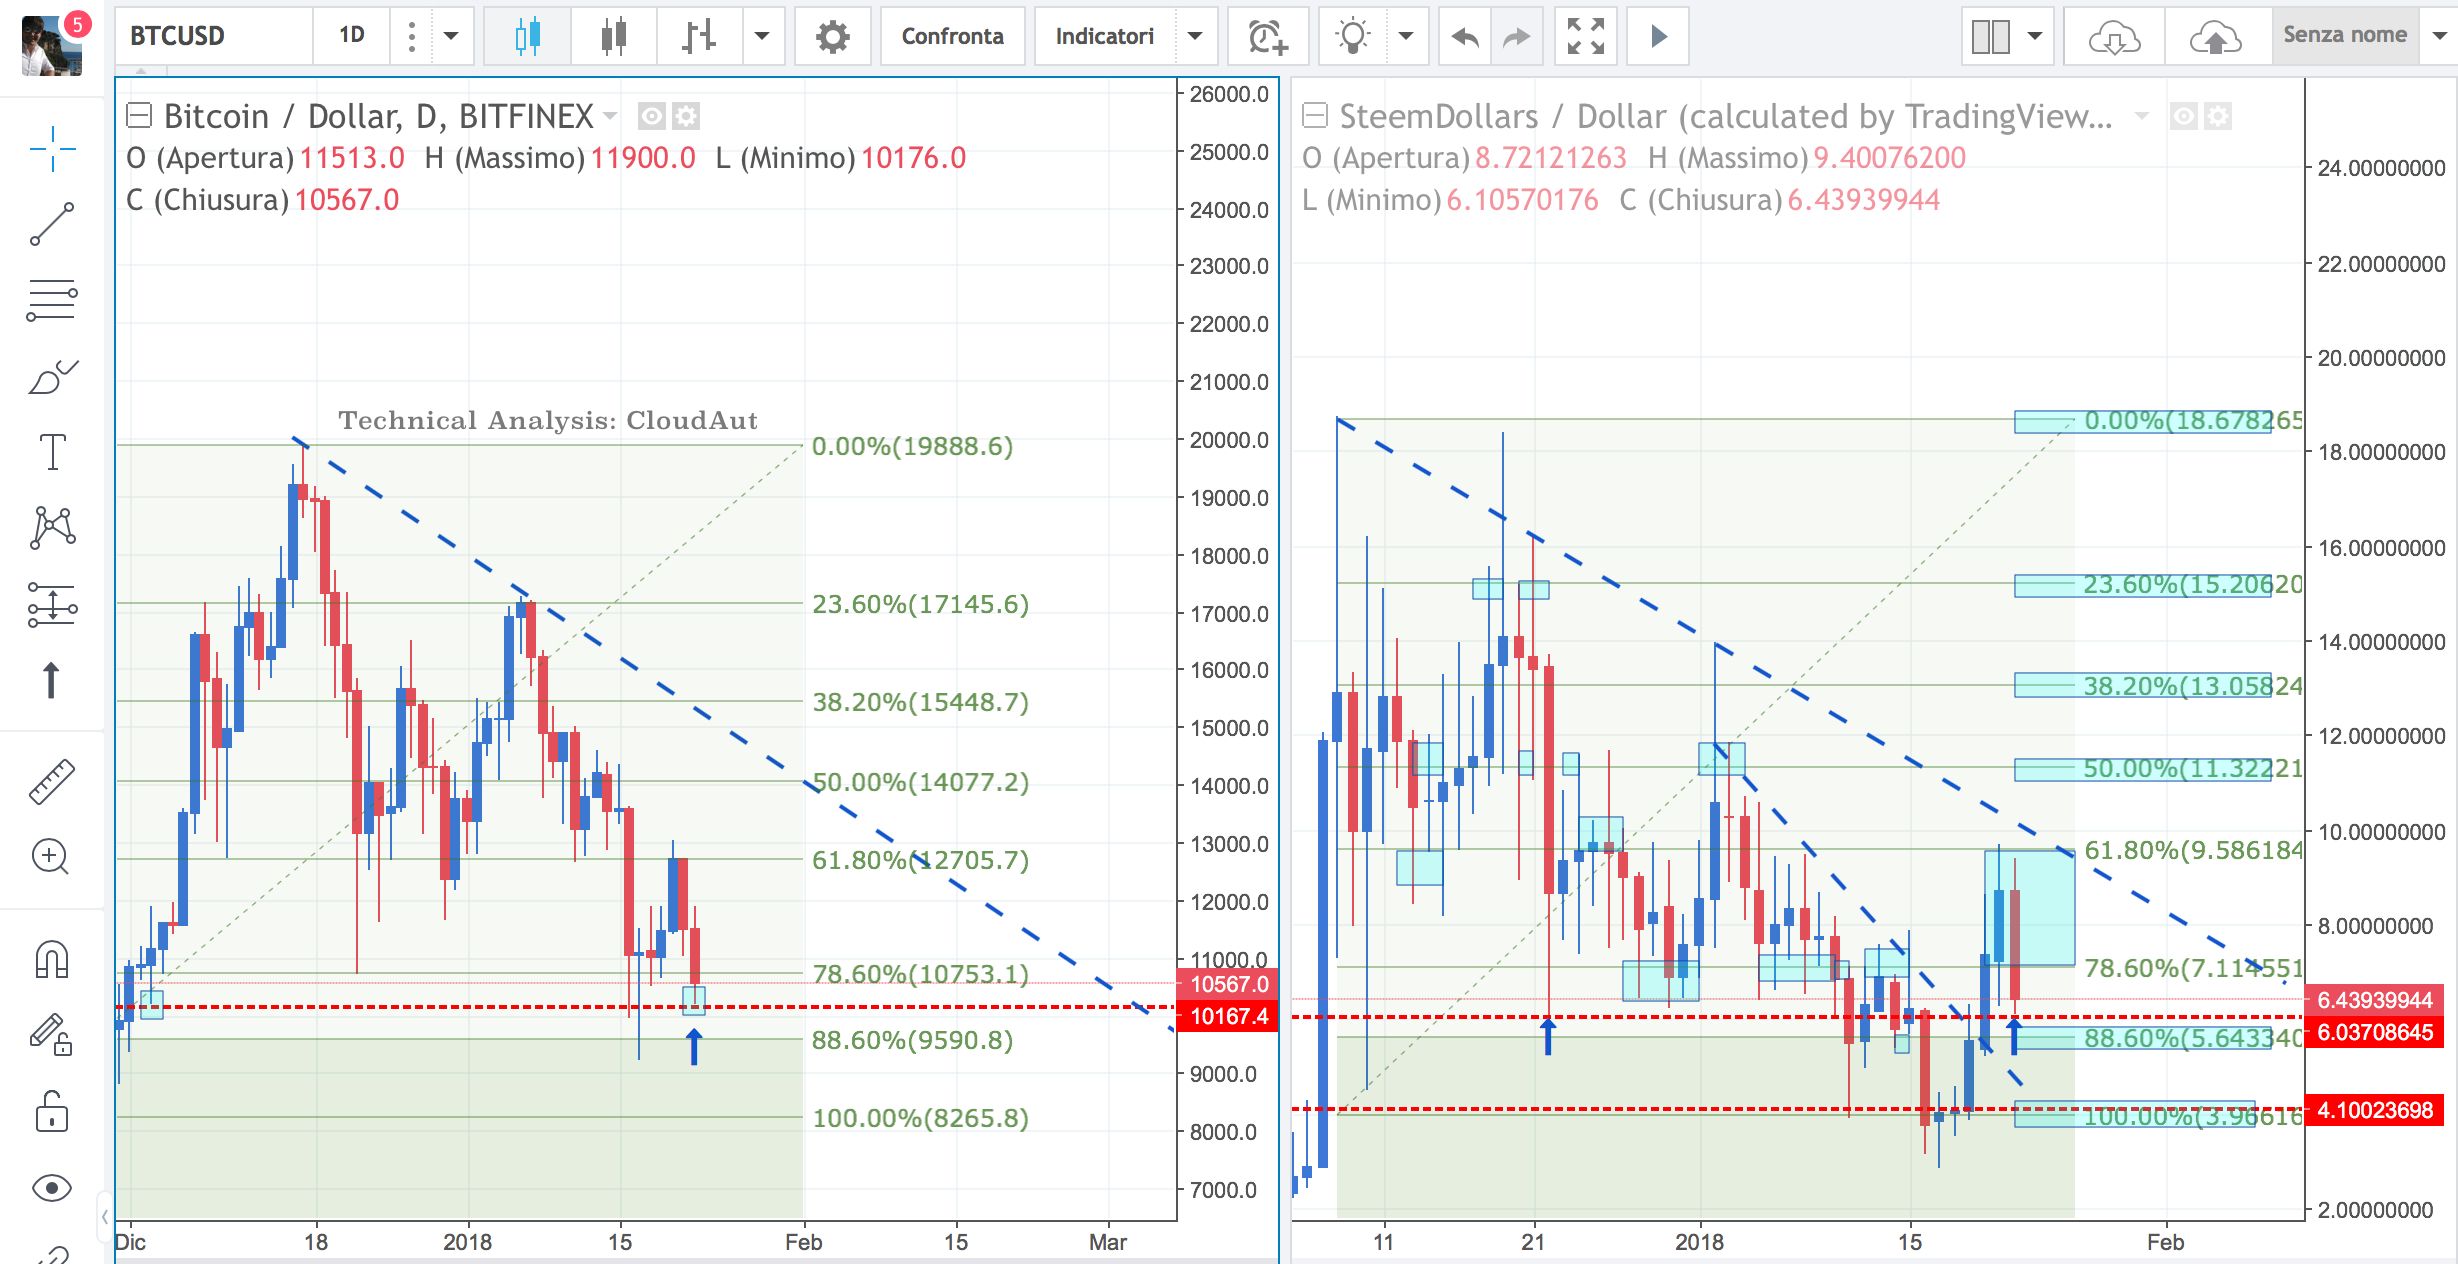
Comparison of the daily chart between BTC / USD and SBD / USD in the last month - Confronto del Grafico giornaliero tra BTC/USD e SBD/USD nell'ultimo mese

I must say that the Steem Dollar respects the Fibonacci levels a lot. This data is very useful for traders looking for a market entry signal.
Today all cryptocurrencies are in red, probably also because of the predictions given to Wall Street by Peter Boockvar who sees the Bitcoin by the end of the year devalue and go into a price range between 1000 and 3000 dollars (source cointelegraph).
Currently the Steem Dollar has gone below the 78.6% level going to test the psychological level in area 6 dollars.
I like to make a comparison with Bitcoin to show the analogies that there are both crypts.
As you can see also Bitcoin has dropped below the 78.6% level
In the chart above I have compared in the time-frame daily Bitcoin (left) and Steem Dollar (right) and you can see that the analogies are not few in the last month.
The last rally of Steem dollar that 6 to 9.5 USD I had predicted in my previous post on steemit indicating in the level 61.8% a probable level of output.
As you can see both Bitcoin and Steem dollar went to touch the Fibonacci 61.8% level.
Obviously, as trading, we are now firm, but a possible close of the daily candle above the 78.6% level invites me to consider a possible trend inversion and therefore a start of a new bullish phase. The confirmation would be given by the breakout on the rise of the dynamic resistance dotted in blue on the chart that is currently around 61.8% Fibonacci.
So, watch out for the 71.8% level for both Bitcoin and Steem Dollar
Disclaimer
Being my personal trading idea, it is not my intention to influence anyone or to invite to invest. Therefore anyone who decides to follow my trading idea will relieve me of any responsibility.
Devo dire che lo Steem Dollar rispetta molto i livelli di Fibonacci. Questo dato è molto utile per i trader che sono alla ricerca di un segnale di ingresso a mercato.
Oggi tutte le criptovalute sono in rosso, probabilmente anche per via delle previsioni date a Wall Street da Peter Boockvar che vede il Bitcoin entro la fine dell'anno svalutarsi ed andare in una fascia di prezzo tra i 1000 e i 3000 dollari (fonte cointelegraph).
Attualmente lo Steem Dollar è andato al di sotto del livello 78.6% andando a testare il livello psicologico in area 6 dollari.
Mi piace fare un paragone con Bitcoin per mostrare le analogie che ci sono trattandosi entrambe di cripotvalute.
Come potete notare anche Bitcoin è sceso al di sotto del livello 78.6%
Nel grafico qui sopra ho messo a confronto nel time-frame daily Bitcoin (a sinistra) e Steem Dollar (a destra) e potete vedere che le analogie non sono poche in quest'ultimo mese.
L'ultimo rally di Steem dollar quello che 6 a 9.5 USD lo avevo predetto in un mio precedente post su steemit indicando proprio nel livello 61.8% un probabile livello di uscita.
Come vedete sia Bitcoin che Steem dollar sono andati a toccare il livello 61.8% di Fibonacci.
Ovviamente, come trading, adesso siamo fermi, ma una eventuale chiusura della candela daily al di sopra del livello 78.6% mi invita a prendere in considerazione una possibile inversione di trend e quindi un inizio di nuova fase rialzista. La conferma mi verrebbe data dal breakout al rialzo della resistenza dinamica tratteggiata in blue sul grafico che si trova attualmente intorno al 61.8% di Fibonacci.
Quindi, state attenti al livello 71.8% sia per Bitcoin che per Steem Dollar
Disclaimer
Trattandosi di una mia personale idea di trading non è mia intenzione influenzare nessuno o invitare ad investire. Pertanto chiunque deciderà di seguire la mia idea di trading mi solleverà da qualsiasi responsabilità.