Today, when we were looking at the Steam price chart, we noticed an interesting similarity. As you can see in the chart below, last year the price remained in a triangle. After that, there was a big increase and the price increased by almost 900%. This was a very big and significant upsurge. However, this uptrend did not last long and the downtrend started again. Steem Price has a long steady correction structure and everyone has the same question in fact. What will be price in future?
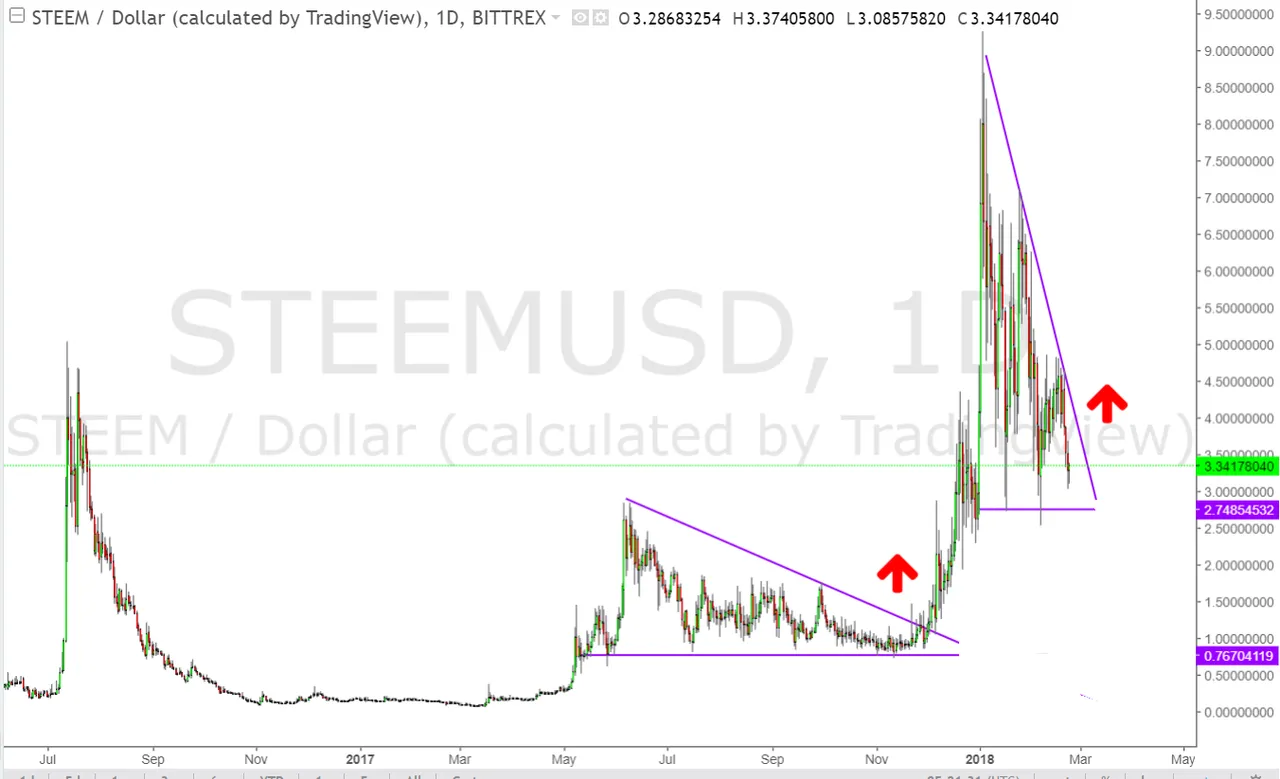
In this analysis I'm just going out of a simple analogy and want to chart your attention again. Nowadays we see a similarity to the triangular correction seen in the chart last year. think we can see a similar upward trend after the falling down band breaks.
If the same similarity is experienced, then the uptrend that will happen is likely to increase by 900%. The price target for this account is $ 27.
Legal Disclaimer: I am not a financial advisor nor is any content in this article presented as financial advice. The information provided in this blog post and any other posts that I make and any accompanying material is for informational purposes only. It should not be considered financial or investment advice of any kind. One should consult with a financial or investment professional to determine what may be best for your individual needs.