
SUMMARY
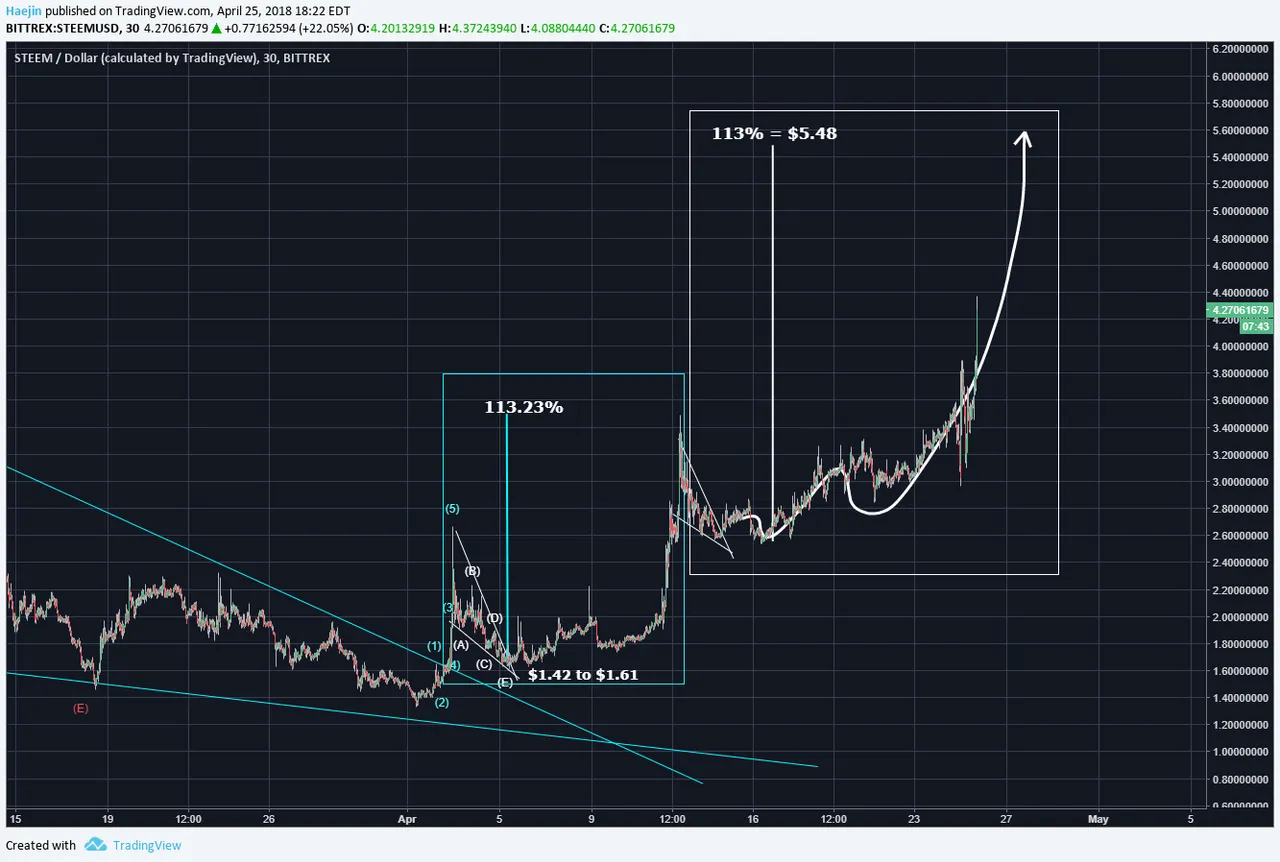
The below projections were made over a week ago. The fractal analysis was introduced even before. One of the recent events that just arrived was the listing of STEEM on Huobi and yes, many are attributing the current rise to exactly that; however, the forecast was made much before the event. This is the bread and butter for any Technical Analyst and is exactly what RN Elliott had taught.
Price has been adhering to the white arrow quite well and I believe now the fractal is very likely to complete very soon. Perhaps before the month of April ends. The rise is expected to be in an impulse sequence of five waves
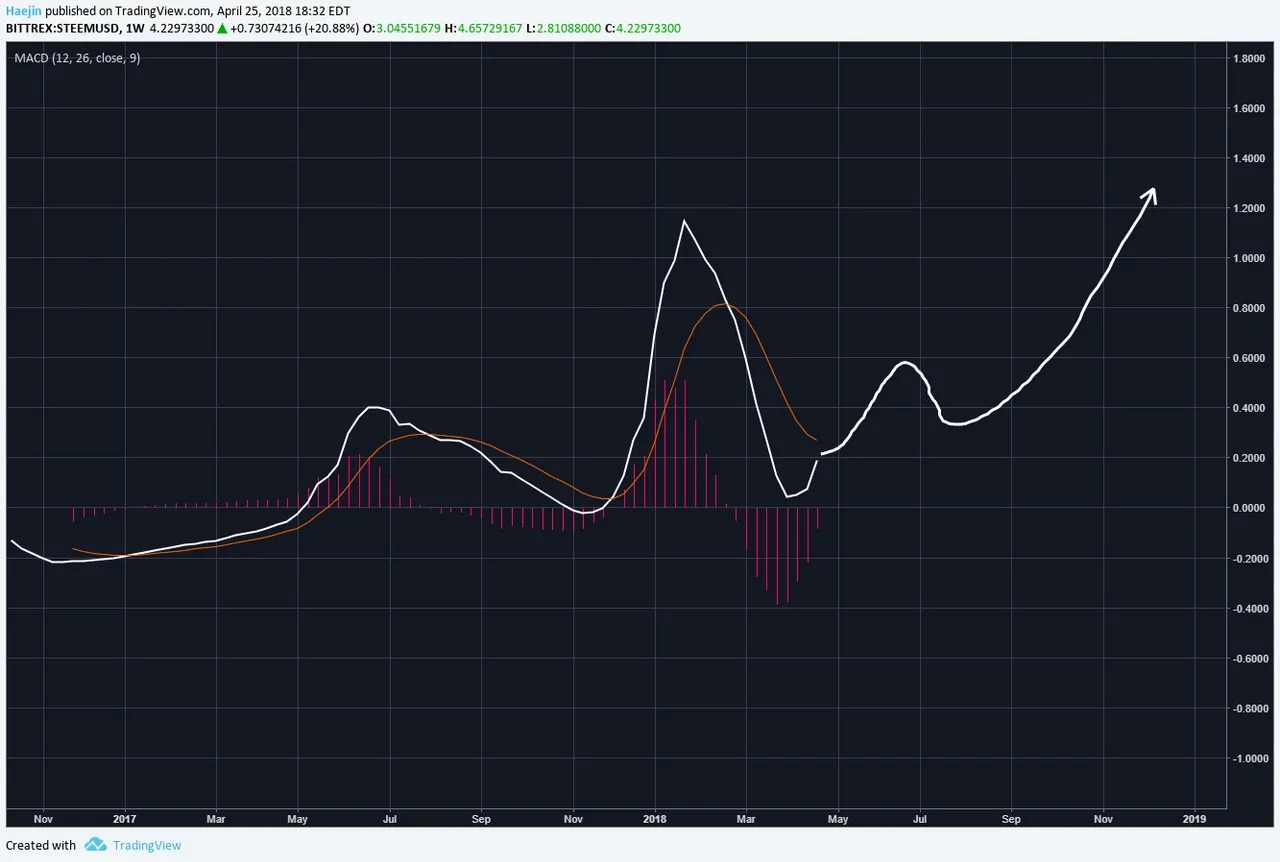
Here is the weekly MACD of STEEM. Soon, a buy signal will occur where the white 12 week moving average will cross up through the 26 week red line moving average. Likely, this will support some phenomenal price rise into July and after a correction, continue the orgasmic upward lunges until early 2019.
Legal Disclaimer: I am not a financial advisor nor is any content in this article presented as financial advice. The information provided in this blog post and any other posts that I make and any accompanying material is for informational purposes only. It should not be considered financial or investment advice of any kind. One should consult with a financial or investment professional to determine what may be best for your individual needs. Plain English: This is only my opinion, make of it what you wish. What does this mean? It means it's not advice nor recommendation to either buy or sell anything! It's only meant for use as informative or entertainment purposes.
Please consider reviewing these Tutorials on:
Elliott Wave Counting Tutorial #1
Elliott Wave Counting Tutorial #2
Elliott Wave Counting Tutorial #3
Laddering and Buy/Sell Setups.
Laddering Example with EOS
Tutorial on the use of Fibonacci & Elliott Waves
@haejin's Trading Nuggets
Essay: Is Technical Analysis a Quantum Event?
Follow me on Twitter for Real Time Alerts!!
Follow me on StockTwits for UpDates!!
--
--

