I've kept a slight look out on Steem. Today I took a closer look.
With a dark outlook on the crypto market, I was shocked to see The RSI on Steem chart on Poloniex.
The Relative Strength Index (RSI) is one indicator of impending price action. When the RSI is low . . . very low as it is now, historically it indicates a price reversal. The last time it was this low was Feb, 20th 2017.
So this is good news for Steem/SBD holders.
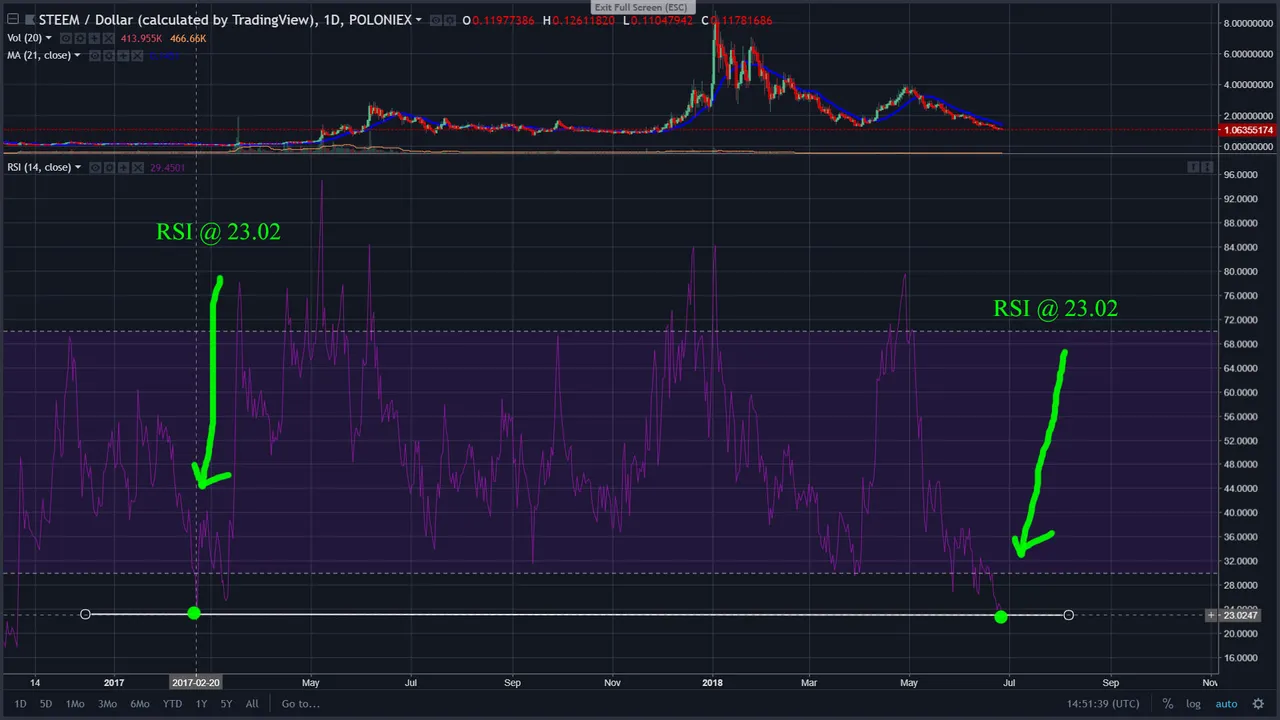
The lower view is the RSI and reversal points. The upper chart is the price of Steem.
( Sbd shows a very similar chart.)
This how I felt when I saw the chart.

A reminder this is not financial advice . . . it is information on how important being able to read a chart is in the market space. Always do your own research.
Best Wishes
H. G.
Source of the video clip: "A league of their own" A movie clip that I got from YOUTUBE.