While looking at charts of Steem, I get an idea of things which were running against this script seems to get over.
Firstly, let me show you, people, a chart of Steem......
Following things were bothering me....
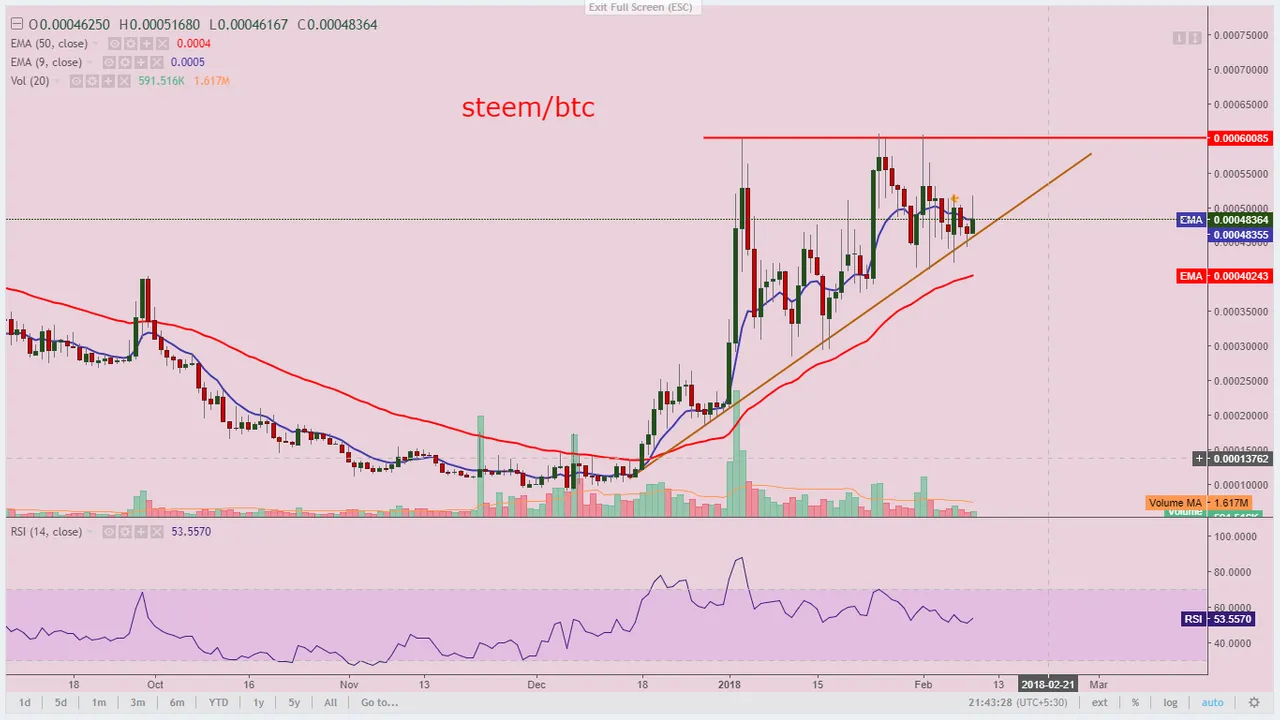
- Ongoing pattern of Lower highs may stop now as Rising Trendline has provided support to steem price which helps price to bounce back.
- Moving averages were seemingly contracting which may stop now as there is a definite attempt of break up from 10 days ema is going on, if succeeded then moving averages may start expanding again which will cement the bullish view.
- Lower volumes or below average volume is still bothering me. These volumes level should move higher to confirm bullish bias in this script, otherwise, lower buyers participation may lead to breakdown from support levels.
- Their is triangle pattern working for this script, if steem manage to break the resistance of 60k satoshi then this script will move much higher with utmost velocity.
With that said, I am signing off this analysis here.
If you like my analysis then do not forget to upvote, follow, comment@jimmyrai28
if not then criticize, this also will be highly appreciated.
You can also drop a comment in 'reply' if want you want me analyze any script of your choice.
Now you can also find me on discord channel: https://discord.gg/VvHmhvH
One can also resteem and get free upvote on their post by just replacing http:\ with re in their post link.