Today I will share a possible breakout in STEEM and will show you 2 different charts from 2 different exchanges which all read the same signal. So lets get started and take a look at the first chart.
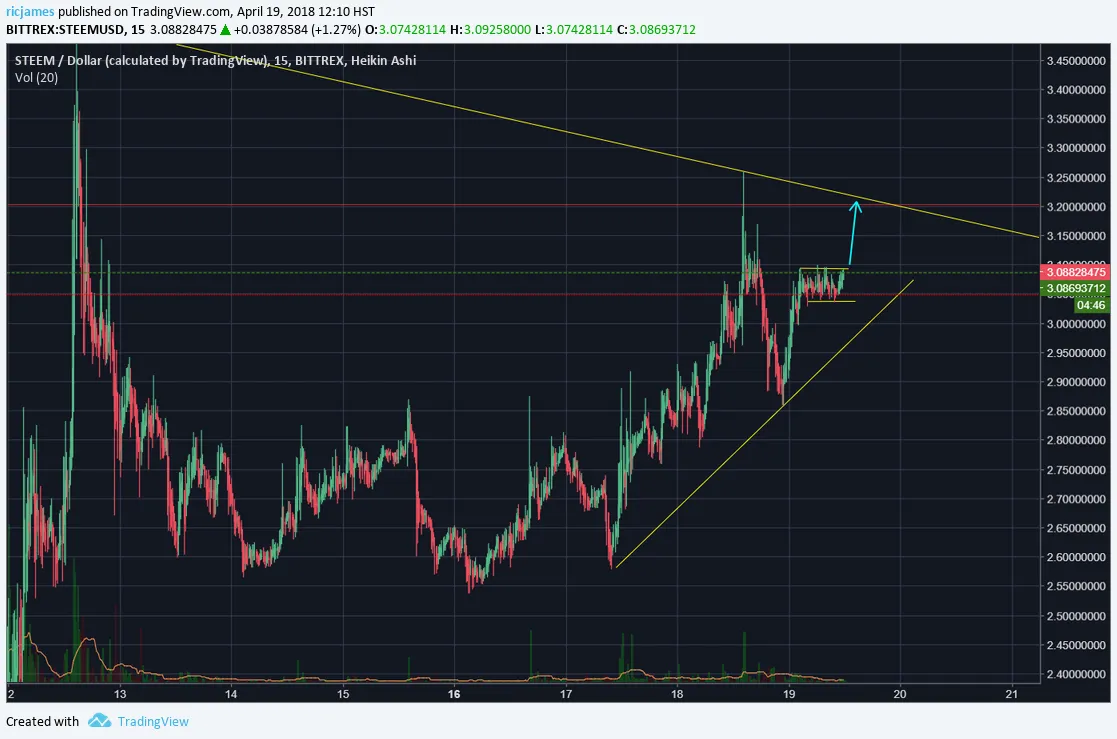
The first chart is one of STEEM/USD on Bittrex. This chart shows that we had an impulse move up, then a corrective pattern and we are waiting for a break to the upside. Now more times than not a pattern like this will resolve itself to the upside so we are looking for a break to the upside and possibly to the high of the previous mark. Or we will see the trendline come into play and knock it back. Personally I think we will break through that yellow trendline on top and either test the high of the previous move or make a new high.
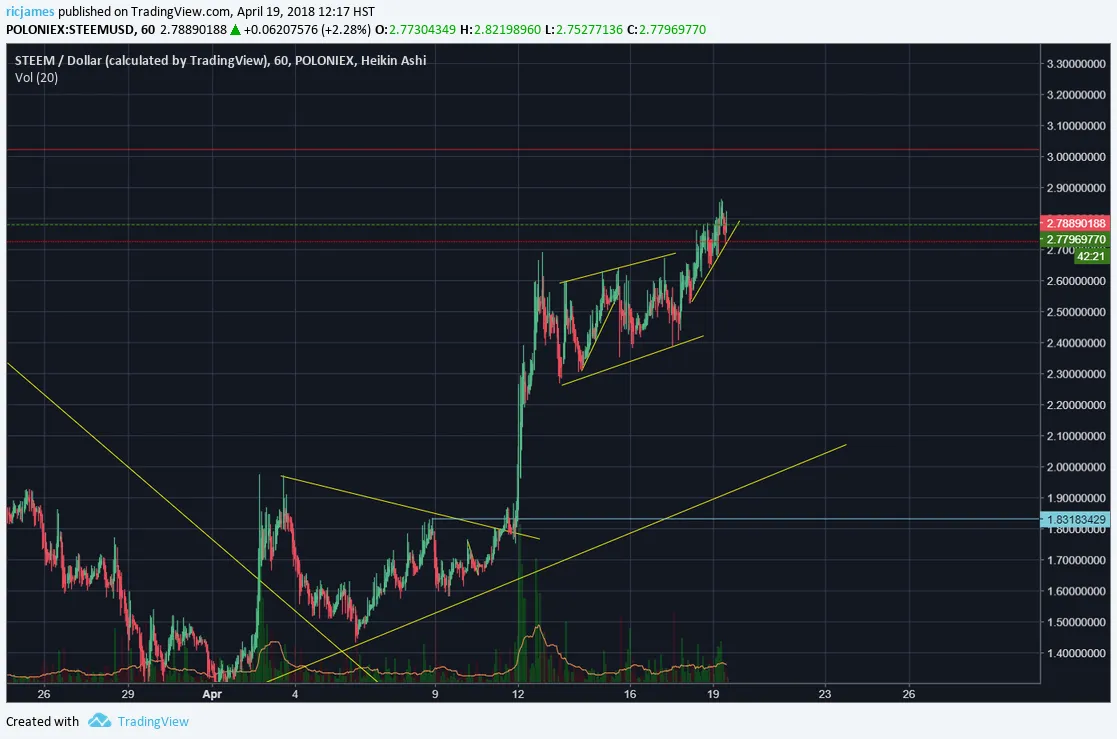
Now this chart is STEEM/USD on POLONIEX. As you can see in this chart, we have broken through the upper trend and it looks like it should continue this trend. So while you should enter this trade you might want to exit after it hits your price target because STEEM has been pulling back after quick impulse moves.