Happy Friday everyone! We're coming to the end of yet another week, and I just have to post an update on STEEM/BTC before the week officially ends.
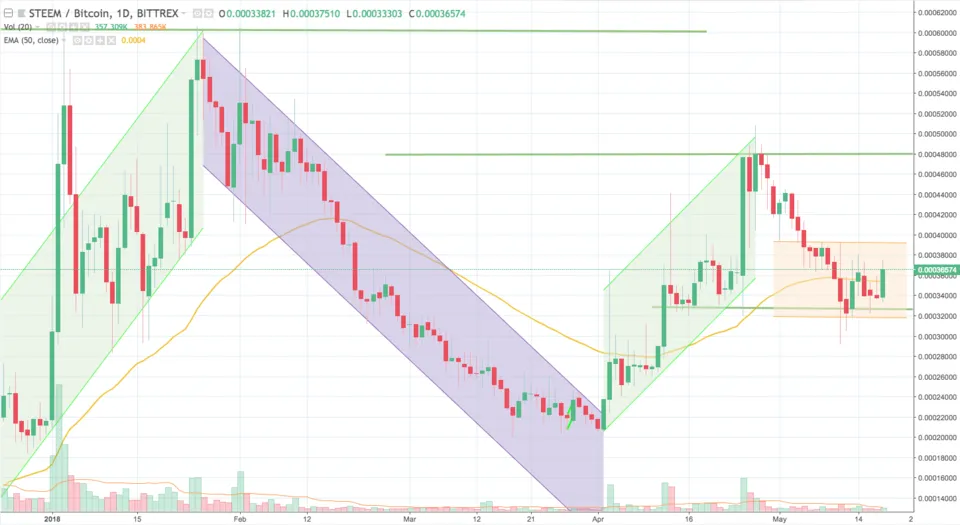
I've added some channels to reflect the recent price movements. Specifically, I've added a (rather short) uptrend channel that ran throughout April, 2018 (depicted by the rightmost green-colored channel). A subsequent retracement ensued, and I believe we are now in the midst of a sideways pattern (orange horizontal channel on the rightmost section of the chart).
There was a lot of price action throughout the week, but as you can see from the chart, we have simply been hovering around the region of 0.00032 and 0.00040. Notice the 50-EMA line in the chart (orange-colored line) -- price has been crisscrossing the 50-EMA line as it seemingly appears indecisive on what to do next.
Support and resistance levels remain the same -- 0.00033 level for immediate support and 0.00040 level for immediate resistance.
Personally, I do not expect a lot of price excitement over the weekend, and believe price should maintain this sideways course.
In any case, I would like to wish you all the best of weekends!
Risk Warning: All comments, charts and analysis on this post are purely my own and should in no way be treated as recommendations or advice, nor should they be construed as an endorsement or recommendation to buy, sell or hold. Please do not trade based solely on the information provided on this post. Furthermore, past performance does not guarantee future success. Always do your own due diligence and analysis when trading.
Chart courtesy of TradingView