I made this annotated screenshot about 12 hours ago, but then wasn't sure about posting it as the recovery was looking a bit iffy! But it's now just about back to where it was then.
So, I'm making this post to illustrate and discuss the downward spike on poloniex and the recovery from it (so far) -- and, because a downward spike (preferably with a lot of volume) can be a good indicator for a positive move immediately after. The volume was only moderate on the spike, but higher than it has been in typical recent trading.
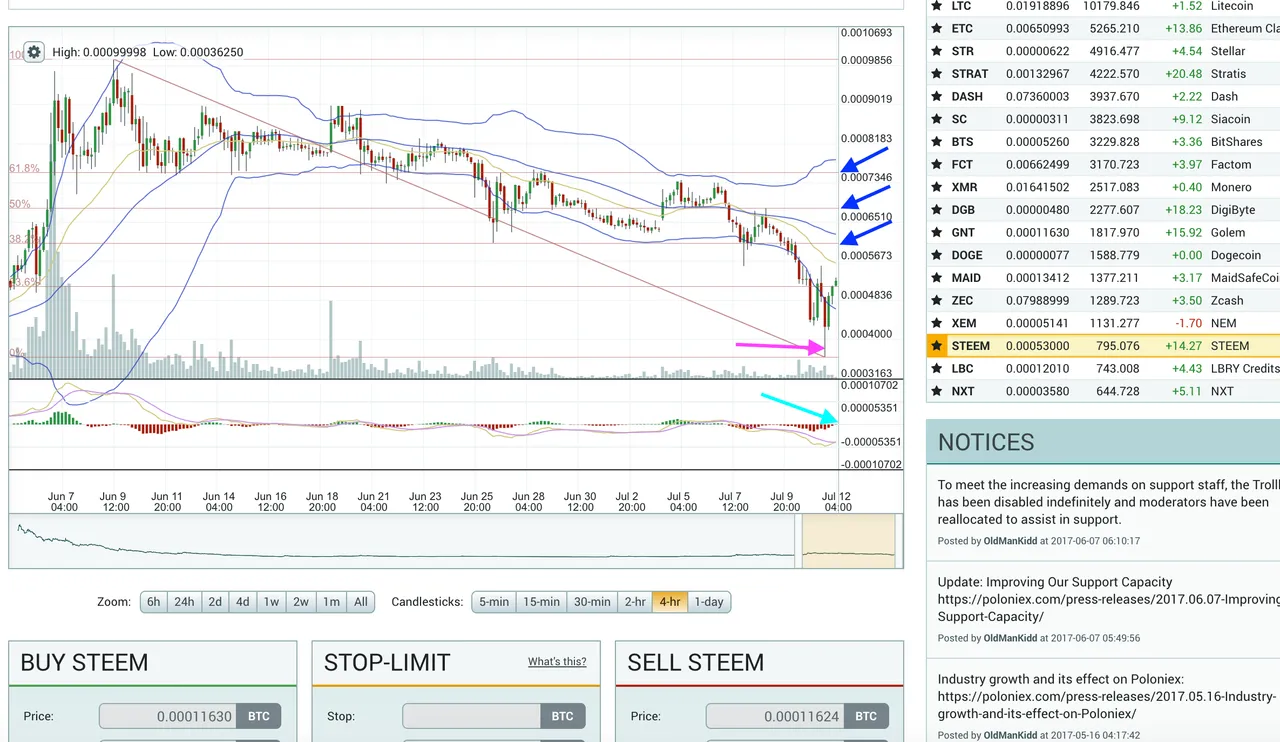
I've marked the downward spike with a magenta arrow.
If this spike marks the bottom point on STEEM/BTC that we are going see for a while, then we can look at the fibonacci retrace levels, which I've marked on the graph with blue arrows - as possible targets that the price could recover to, on this bounce. Personally, I like to look for the 50% retrace level, in particular, as a good potential target.
One other indicator of note on this graph is that the 4-hour MACD is looking like it could be about to turn green (marked with a cyan arrow). [Update: it has turned green now.]
On the other hand, I'm still not liking the overall curve on that chart too much, because it's a downward curve!
Finally, lets look at the order book:
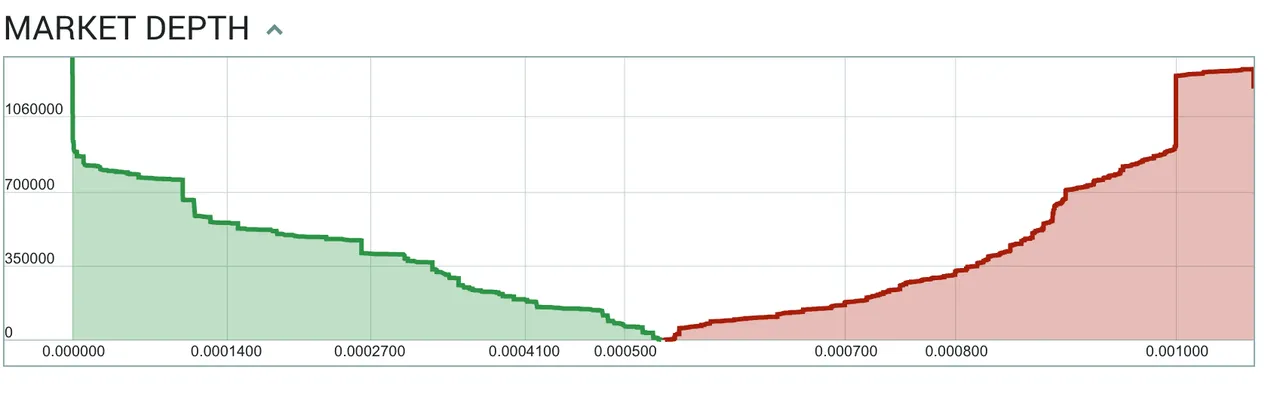
This is looking very much better than it was a week ago, because we can see it's now pretty even on each side. Of course, a large part of this is because the price has fallen very significantly during this time.
Will STEEM go up or down from here? I don't know. But these are the charts I've been looking at, to try to decide :)
DISCLAIMER: This post does not constitute any trading advice, and the reader must make up their own mind on any trading decisions.