D3.js
A data visualization library, written in javascript
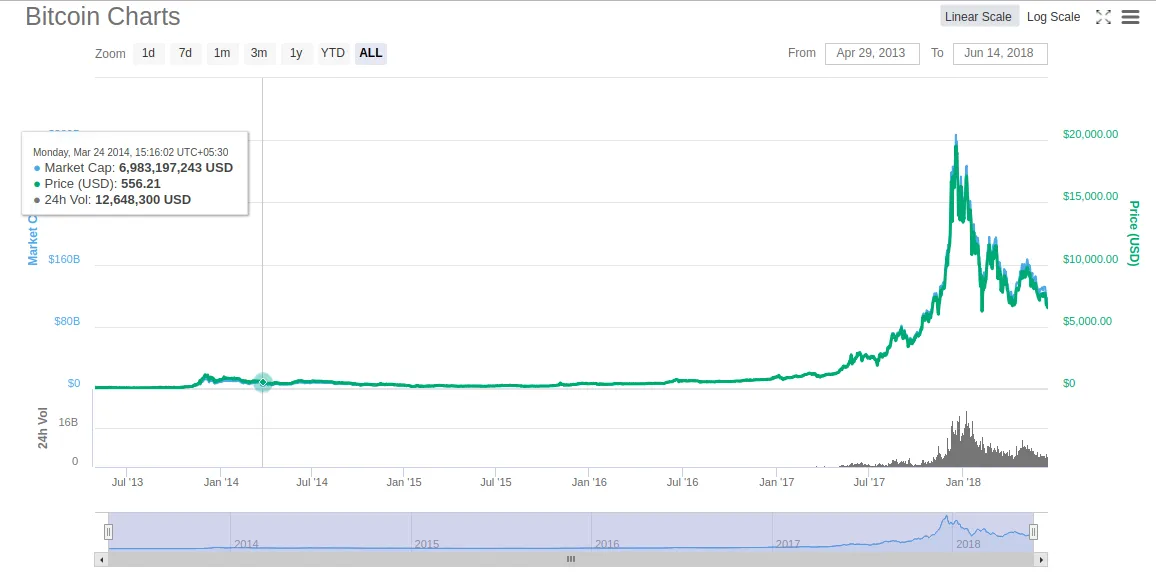
Screenshots
Hunter's comment
D3 (or D3.js) is a JavaScript library for visualizing data using web standards. D3 helps you bring data to life using SVG, Canvas and HTML. D3 combines powerful visualization and interaction techniques with a data-driven approach to DOM manipulation, giving you the full capabilities of modern browsers and the freedom to design the right visual interface for your data. Source - Github Intro
D3.js is the coolest tool out there in the npm ecosystem for visualizing data in form of charts, graphs, pie charts etc. D3.js can be used to create great analytical and data driven visuals in real time and can be used in various applications that need to interpret data from server and show various analytics on it. D3.js is already being used by some of the most popular applications in coin tracking, weather forecasting, surveying and big data analysis. And the best thing about d3.js is that is uses web standards, which means that you can create SVG elements using D3 and style them with external stylesheets using CSS. You can also use composite filter effects, dashed strokes and clipping.
If you are working with an app which requires to visualize data in lot of creative ways, d3.js is your one stop solution. You can go the various D3.js Examples and learn how to use D3.js from their documentation.
Link
Contributors
Hunter: @aneilpatel

This is posted on Steemhunt - A place where you can dig products and earn STEEM.
View on Steemhunt.com