plotly
Visualize Your Data Modernly
Screenshots

 View Image |  View Image |
|---|---|
Hunter's comment
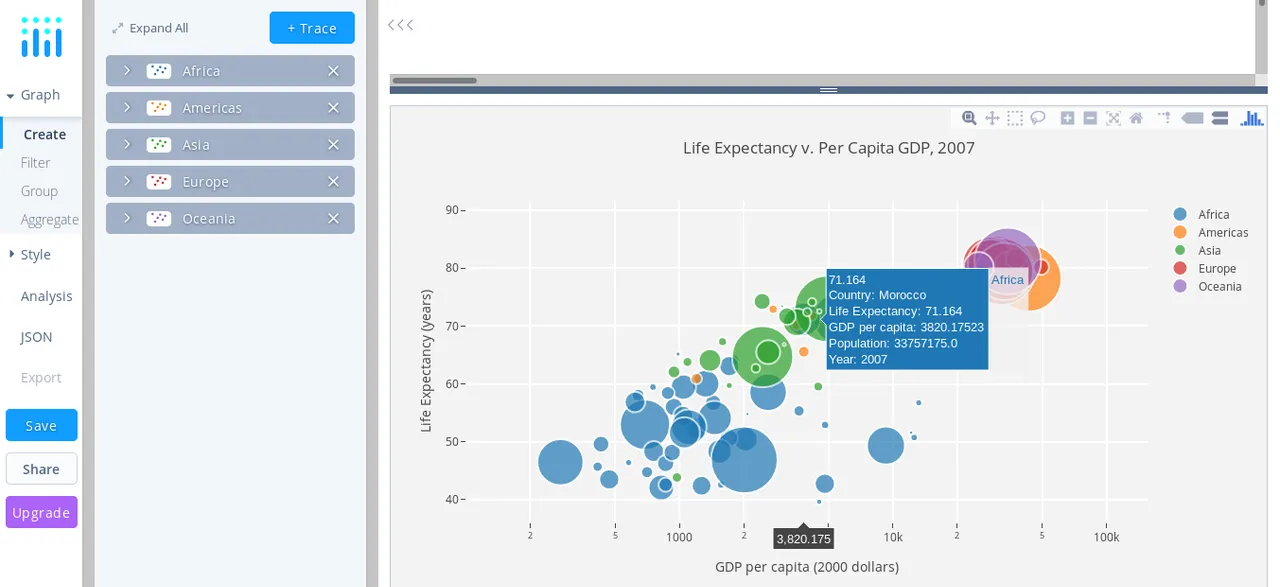
Are you a developer who plays with data and visualizes it as a report or presentation? Plot.ly is an open source tool that can be used to create, edit, and share data visualization interactively through the web.
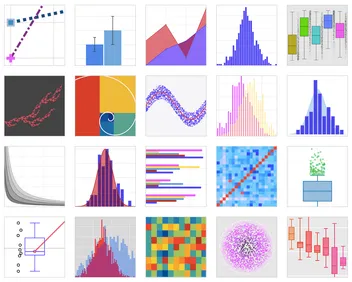
Plot.ly can be used to create charts, analytic data applications and create visual reports online.
Plot.ly is created using Python programming language and uses Django framework, JavaScript as front end and D3.js for visualization as well as HTML and CSS.
Link
Contributors
Hunter: @iqbaladan

This is posted on Steemhunt - A place where you can dig products and earn STEEM.
View on Steemhunt.com