Hi,
I need for work a tool for visualization of dynamic data and I learned vis.js. Very cool tool for visualization in browser using javascript. The performance is incredibly. Yesterday I tried on golos.io and worked like a charm, despite some mistakes I did. And I needed only 15 minutes to create this visualization.
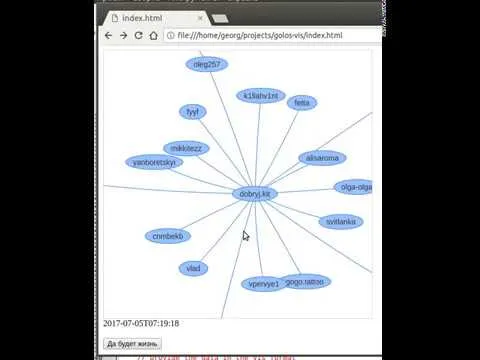
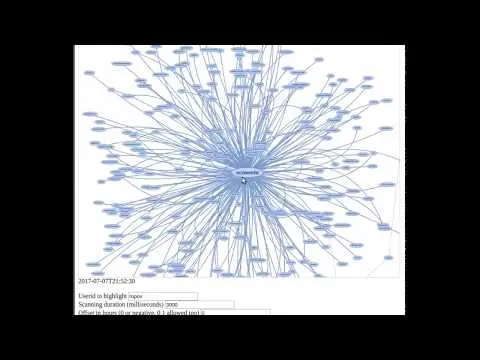
I created a simple web page, where you can run the visualization self in your browser. Webpage is accessible there http://ropox.tools/golos-vis/ You can set the duration, how often the blockchain is scanned. Usually a block is generated every 3 seconds (3000 milliseconds). You can enter offset (negative number in hours, real numbers are accepted).
There is a video on youtube with some few moments from steemit. Steemit should be scanned slower. ))
Sourcecode is published on github there https://github.com/gropox/golos-vis
Enjoy!