Many people are wondering where the price of Steem is headed.
Let's look at the charts for clues.
The Steem weekly chart has a lot to say.
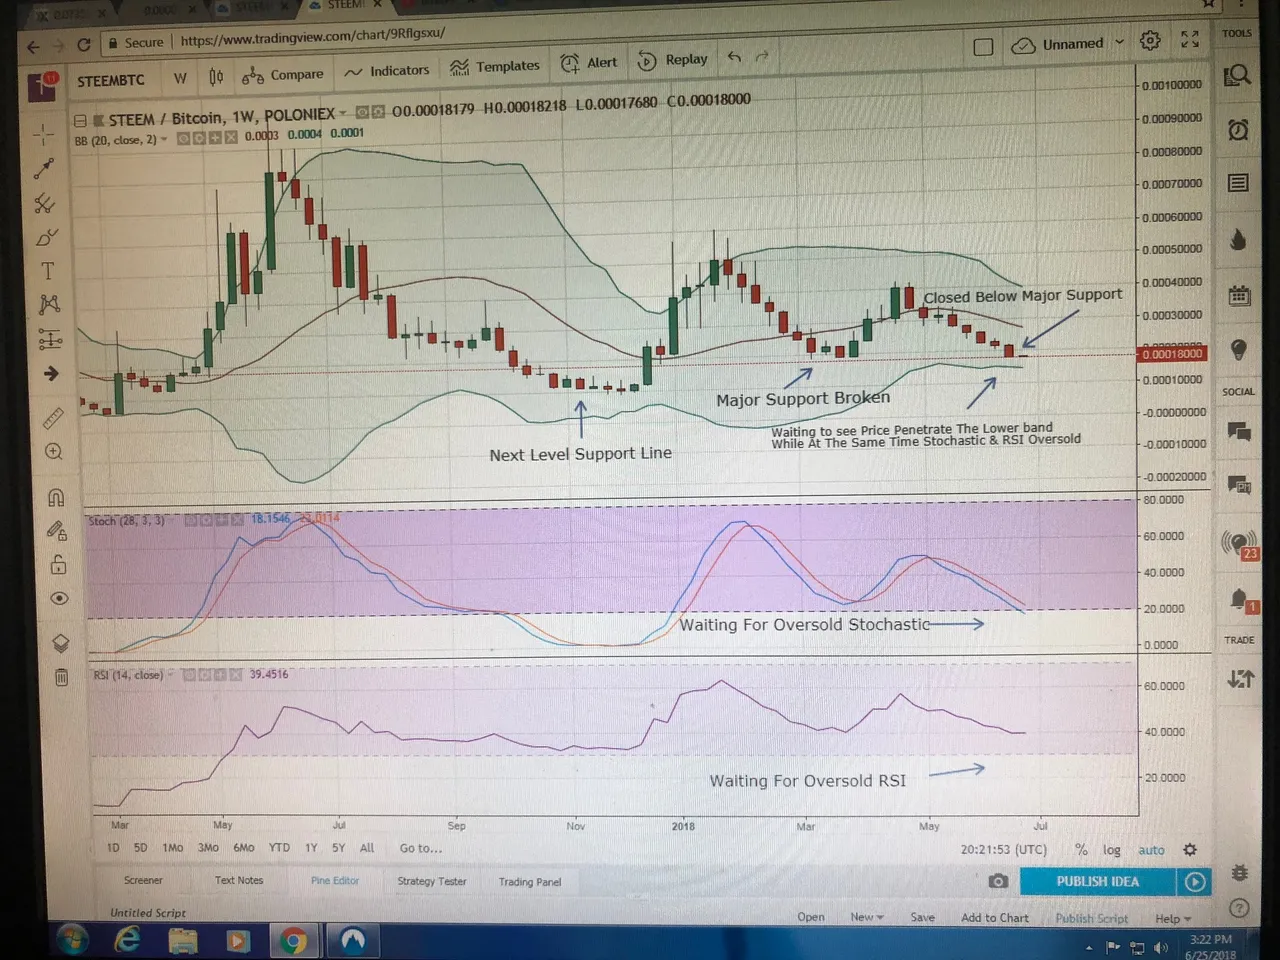
First this past week we closed below a major support level.
This tells the alert chartist that there's a high probability of more down side action.
So the question is how far down can we go?
Well we can see on the chart that the next major support level is below the lower ban.
(That's a positive sign)
Also the weekly stochastic is headed into oversold territory and RSI is not far from being oversold as well.
The chartist will be watching closely when and (if) the price penetrates the weekly lower band.
If at that time the stochastic & RSI indicators are oversold that will tell the chartist that the bottom is near.
Now let's look at the daily chart.
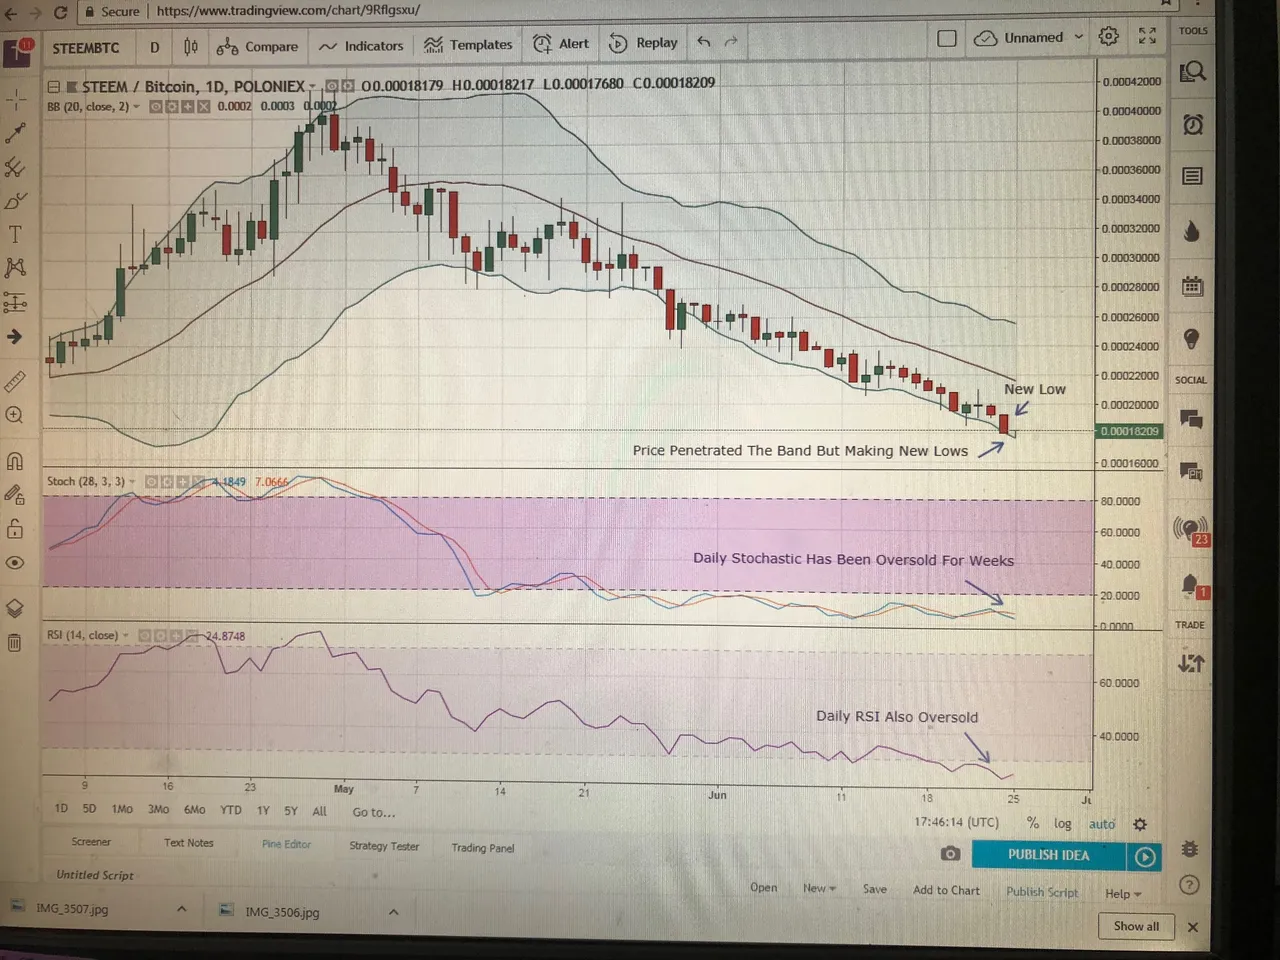
Notice that the price has penetrated the lower band.
While at the same time stochastic has been oversold for weeks & RSI is oversold as well.
The problem is we're still making new lows so this is why we have to properly analyze the long term weekly chart.
Trader's View: Right now the down trend is set to continue. There is a high probability for a temporary move up.
Follow this page for further updates.
Please support this page: upvote comment resteem