Clustering in mathematics is as exciting as a bread. We all use it, not really enjoying in that process and whatever we do, it's more-less the same. At least I've thought so until the matematician wizard sent me his latest state-of-art paper.
Boring clustering
The very first association to clustering is certainly the k-means clustering, invented in the 50's by several authors. The idea is very simple, you type the number of clusters you want to get, the algorithm finds the points that will be the centres of the clusters and it's done in such manner that the distance of the data from the center(s) of the cluster(s) is as small as possible.
If you want to learn more about it, visit StatSoft STATISTICA Help centre, it's explained in a very clear manner and you will master this skill in less than hour.
If you are a biologist, you are certainly familiar with the Tree Clustering, the method that you will find in every book related to taxonomy or evolution. The logic behind the algorithm is again very intuitive and easy to understand. Take your data points, find the distances between them, see the linkage distances and say where you want to cut.
And there is nothing spectacular you can do. You can play with methods for calculation of the distance including the most classical Euclidean distance or you can square it, or if you feel particularly good, you can go for the Manhatan'distance metrics.
You can also add some weights to data points and that's it...
So, what's the problem?
Well, the first one is very obvious even from this Wiki example:
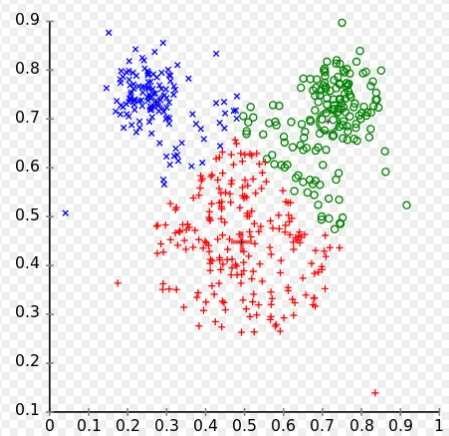
Your gestalt brain can clearly see 3 circles, but explain it with mathematical language including the distances from the centres.
And, just for fun, imagine the "doughnut shape" data. How could that be clustered using classical k-means? Or even worse, two concentric circles. Simply there is no way to do it properly.
Wizard(s)... KNSC-Ncut (kernel-based nonnegative subspace clustering)
Type this with quotation marks in Google and you will get one single hit, the one done by Ivica Kopriva (ako se nekada učlaniš na Steemit, nagrada od ovog posta je tvoja).
The whole idea emerged from NMF, non-negative matrix factorization, one of the best methods for dimensionality reduction (tested in real world). The main reason for this can be found in the name, all the elements of the matrices are positive. Translated to ordinary language, all present components in the spectrum, for example, contribute only positively. There is no "anti-component".
Now, instead of using data in "as it is format", weighted affinity graph is constructed first.
*(each node represents data point and each weighted edge represents the distance between the points)
If you have no idea what is the affinity graph...
Spectral clustering then finds the cluster membership of the data points by using the spectrum of an affinity graph
But... This approach can give mixed-sign results due to eigenvalue decomposition of the Laplacian.
So instead of the application of eigenvalue decomposition - NMF...
And now if you like math, you see what you could do ;)
How it works in practice?
Authors tested some publicly available datasets and the size of matrices varied from 214 samples x 9 dimensions for 6 clusters to 400 samples x 10.304 dimensions?! for 40 clusters.
Now you know that clustering can be interesting, that it can solve some incredibly difficult problems and that fine tweaking of the algorithms can make it even better for your particular case