Hello friends returning with my unique series on the platform in which I hope in the future will be very useful for different undergraduate students in learning during the process of academic training.
In the previous installment I talked about fluorescence spectroscopy, during my writing I mentioned in a part that I would show a basic experiment about fluorescence spectroscopy, where through a grid spectrometer we calculate the wavelengths of different gases. Next I will explain in detail what this experiment consists of.
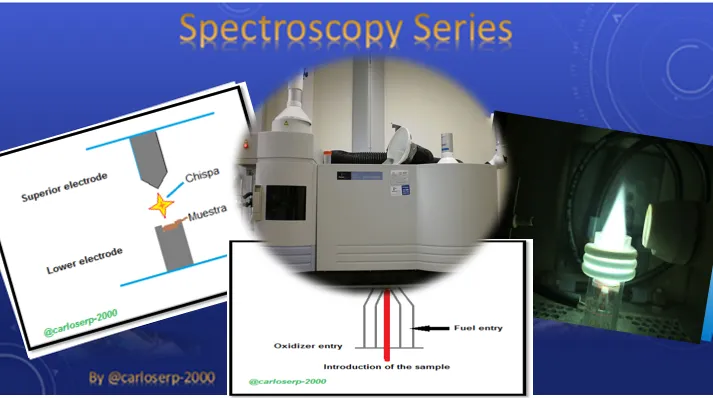
We already have quite clear knowledge of what spectroscopy is all about, thanks to the different deliveries that I have shared during the last months. The spectroscopy is one that is responsible for the study of matter through electromagnetic radiation. In this post we will focus on the emission spectroscopy, through this we will proceed to identify three different types of gases unknown at first instance, all this according to the observation of the spectral lines that are identified through the spectrometer. Before that we must know how this equipment is composed, its calibration and important details about the composition for a reliable measurement.
Emission spectrometry is a technique used to analyze wavelengths of photons emitted by atoms or molecules during their transition from an excited state to a state of lower energy. Each element emits a characteristic set of discrete wavelengths according to its electronic structure. By observing these wavelengths, elemental composition of the sample can be determined.
Thanks to this technique, different spectral lines can be identified and separated with a diffraction grating. These beams of light wrapped in this phenomenon with their respective wavelength must overlap and thus produce very sharp lines of different colors depending on the material being identified, in the grid the light undergoes a diffraction and is diffracted from a long wave to a short wave.
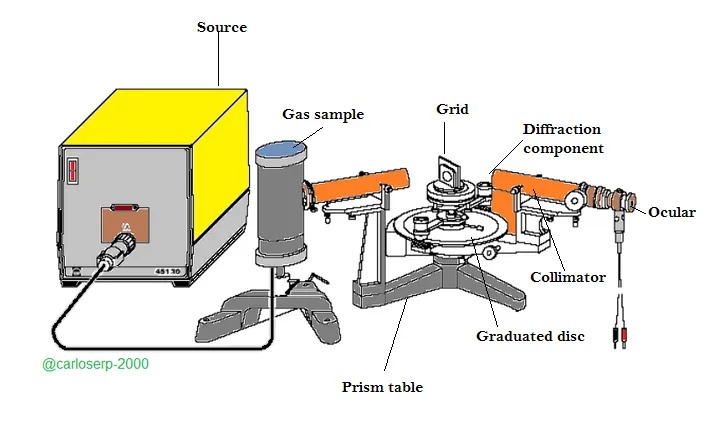
Before beginning the experiment we must know the composition of this type of spectrometer, which are:
The first component is the Collimator, which is formed by a small grid whose main function is to make the light smaller and be able to correctly address the component that diffracts said light.
Then we have the diffraction component, which is responsible for doubling the beam of light that later divides forming a spectrum of visible light, which in turn is internally shaped by a prism that is the one that disperses this light.
Something that we should not leave out, is that by counting the deviations of each line of the spectrum of a gas or any element that we want to identify, we can calculate the wavelengths corresponding to this spectrum. Based on these, the light source can then be determined by comparison with suitable table values.
And finally we have the last component of the spectrometer that is the Ocular, in which we can observe the spectral lines resulting from the diffraction of the beam to measure the wavelength of each one.
In practice with the grid spectrometer we must take into account certain considerations to make some measurements correctly, in this opportunity I will briefly explain essential tips for an adequate adjustment of this equipment.
To be able to highlight precise measurements that translate into reliable results means that we must have a perfectly calibrated spectrometer, for this we must take into account certain very important considerations when assembling the equipment, as for example it must be carefully adjusted since much of the his pieces are very delicate. The slit and graticule are two components that must be directed in the focal plane, that is to say in the path where the beam of light passes and is diffracted towards the telescope, these in turn must be parallel to the axis of rotation of the telescope. To be able to observe the spectral lines in a correct way and that can be differentiated, the environment is recommended to be in total darkness, this also facilitates the adjustment of the spectrometer.
It is very important to note that during the pre-adjustment of the equipment, the table plays a fundamental role at the time of calibration, the inclination of this can vary within certain parameters. Ideally, the prism table is in a horizontal position to control its calibration with the naked eye.
It is also important to mention the following, some people suffering from an eye disease can observe distant objects with the telescope, this does not necessarily have to focus towards infinity as some people say, this is totally false! However, effective measurements can be made if the person correctly adjusts the collimator with the telescope focused toward infinity. You can slide the eyepiece in order to achieve greater clarity and so people can easily observe the spectral lines. Since the image of the material must meet the focal plane, there must be no parallelism between the object and the reticle, it must be correctly focused.
Experimental setup
I could say from my personal perspective and experience in the handling of this spectrometer that putting together this equipment is quite simple. First we must fix the spectral lamp of He along with the base of the support, we must connect the coil that generates the current and later turn it on. The He lamp should illuminate the slit completely, emphasizing finding the appropriate optical axis of the lamps to the collimator. We must position the grid on the table of the prism so that at the moment of making the measurements place the telescope so that the beam of light can pass through the slit and thus illuminate the grid completely, in this way we can observe the spectra comfortably through the ocular.
To obtain very effective measurements it is important to place the grid on the axis of rotation of the telescope and in turn to direct vertically to the optical axis of the collimator, that is to say half of the table of the prism.
The resolution tends to grow as the width of the slit decreases, in turn, the light intensity of the spectrum becomes smaller. And finally with the micrometric screw, take the width of the slit to a suitable value.
Experimental assembly of grid spectrometer
Now, after having explained the above, we will proceed to identify 3 different types of gases. For this procedure as it has been developed in the previous points, a variable resistance is needed between the source and one of the electrodes on which the container tube of the gas to be identified must be fixed, in this case the mercury, the tube is located in front of the collimator. Another way to calibrate the spectrometer is to use a container tube with a known gas, in this case we use mercury since its spectral lines are very easy to observe and we know their corresponding wavelengths, this is done in order to adjust the scale properly of the spectrometer.
Once the equipment is calibrated, we move on to the next stage, which is to identify the 3 types of gases and their respective wavelengths, finally a comparison will be made with theoretical studies and finally we will be able to identify what type of gas we are observing.
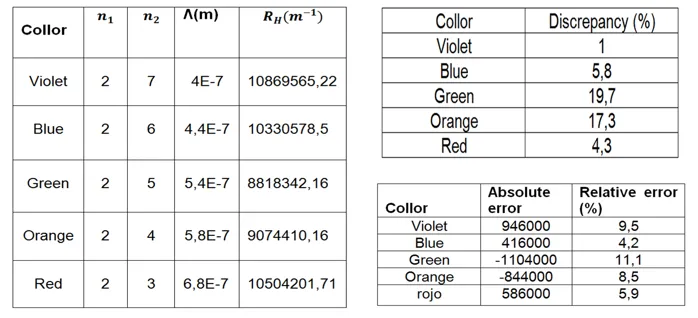
To calculate the wavelengths we must use a very famous equation, where one of the outstanding scientists was Johann Balmer, who devised a mathematical model by which the wavelengths characteristic of the spectral lines of hydrogen and similar elements could be obtained. Later Johannes Rydberg improved this model by making it dependent on the wave number instead of its length, to this was added a constant value which bears his name as:
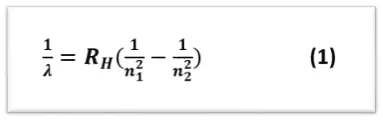
Where λ is the wavelength, RH is the constant of Rydberg, n1 and n2 are the values that represent the orbital levels of the atom, which determine the series to be used, for the present study the so-called Balmer series was useful.

Now, let's perform the experiment
As mentioned, we will use mercury as the calibration element of the spectrometer, in the following table the respective wavelengths corresponding to the mercury gas are shown.
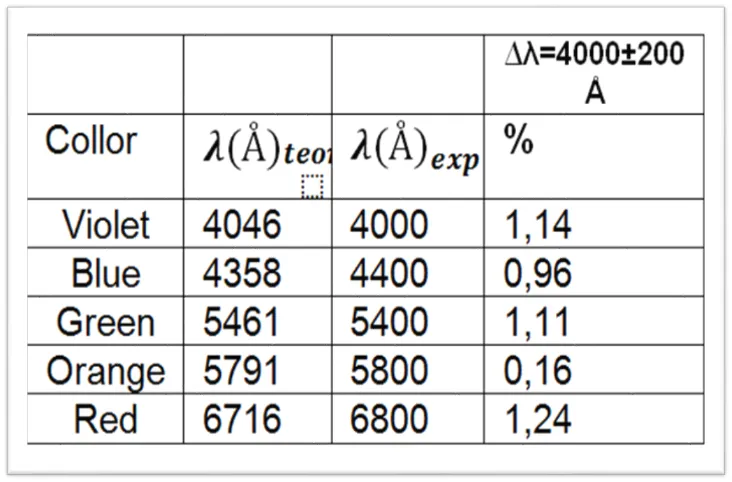
Table 1. Wavelengths of the mercury emission spectrum
Afterwards, the grid spectrometer will be calibrated and each spectral line of the mercury gas will be visualized, we proceed to identify the 3 tubes containing unknown gases and after having identified each spectral line corresponding to each gas, we must compare the experimental values with the values theorists based on a specialized program to identify gas spectrum called Atomic Spectra.
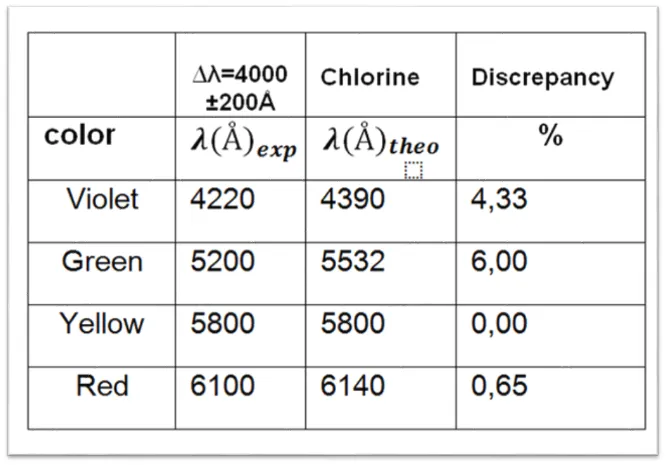
Table 2. Observed wavelength values for tube 1 containing Chlorine.
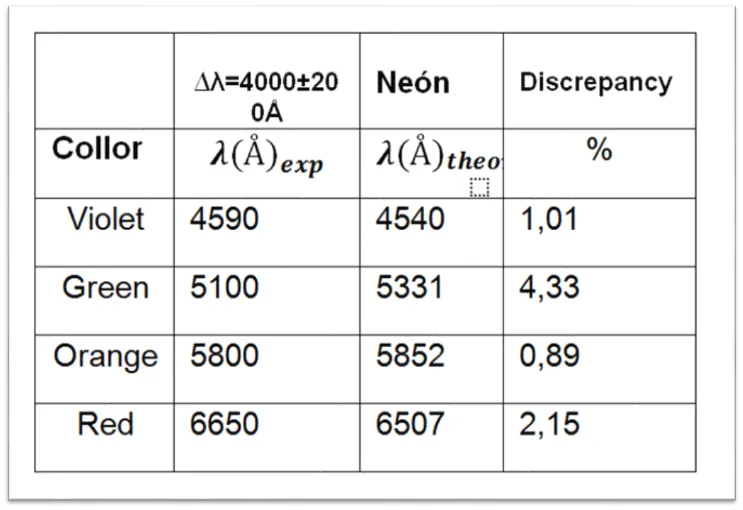
Table 3. Observed wavelength values for tube 2 containing Neon.
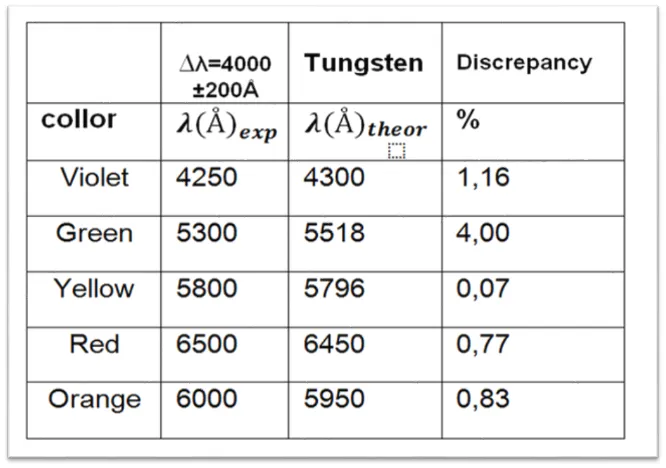
Table 4. Observed wavelength values for tube 3 containing Tungsten.
After making the experimental comparisons of the emission spectrum with the theoretical data, each tube has been identified according to the color of each spectral line. The first tube belongs to the spectral lines of the Chlorine. The second tube belongs to the Neon and finally the third tube belongs to the Wolfram spectrum.
The final part of the experiment consists in calculating the Rydberg constant of the mercury tube, with the results obtained experimentally from each spectrum, this constant has a theoretical value of 1.097x10exp7 mexp-1, which we will compare and obtain its% discrepancy.
To conclude the spectroscopy is a very broad field, as I have been sharing the last months has a variety of techniques and could be said to be used in all fields of science. This experiment on the grid spectrometer based on the emission and fluorescence spectroscopy is a subject that is dictated in the undergraduate degree in physics, a basic and important subject for the students of the race. In this experiment, the objectives were met successfully, since we were able to visualize, through the device, spectral lines of different gases and also identify which type of gas corresponded to each tube and also calculate the corresponding wavelengths, such as the Rydberg constant. , with a margin of error or discrepancy of 0.92 for mercury, 2.7 for chlorine, 2.1 for neon and 1.37 for tungsten.
It is important to remember that to carry out this experiment certain considerations must be taken, such as a good calibration and adjustment of each component of the equipment in order to obtain viable results.
You want to know more about my spectroscopy series visit the following links:
If you want more information about the subject you can visit the following links:
Grid spectrometer for visible and ultra-violet range
- Robert Eisberg y Robert Resnick. "FÍSICA CUÁNTICA". 2011. Editorial Limusa Wiley. P 126-130.
- Mark Kness, 2002. Aplicación AtomicSpectra. V1.0 Copyright 2002.
Publish through our official app and you will get an extra vote of 5% https://www.steemstem.io/
 Video credits @gtg