Today let us try understanding correlation maps. It is very common to see correlation maps of protein motions in molecular dynamics research papers. For example, see the figure below:
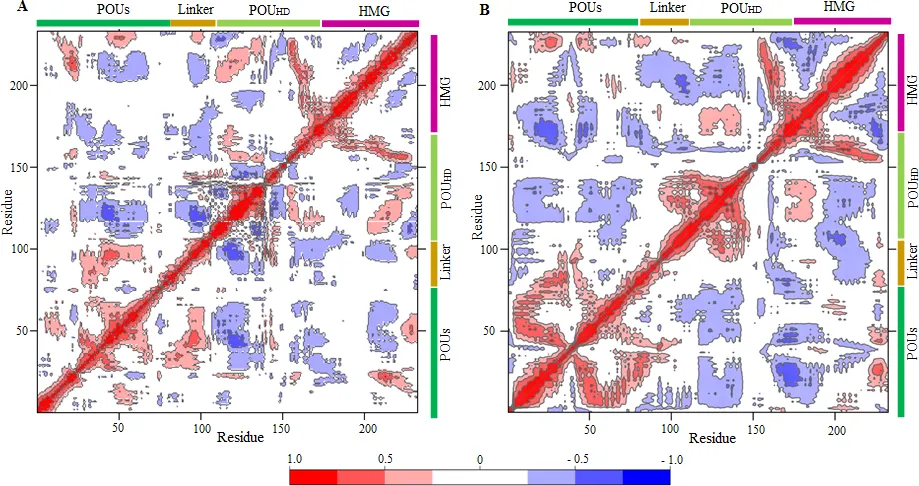
A typical correlation map. The red regions positively correlated, blue for negatively correlated and whitish regions are more or less zero correlated. Ref:Yesudhas D, Anwar MA, Panneerselvam S, Durai P, Shah M, Choi S (2016) Structural Mechanism behind Distinct Efficiency of Oct4/Sox2 Proteins in Differentially Spaced DNA Complexes. PLoS ONE 11(1): e0147240. https://doi.org/10.1371/journal.pone.0147240. License:CC Ver 4
The above figure shows correlation maps of a protein complex(Oct4/Sox2) under 2 different conditions. Both are exhibiting different correlation map signatures. These kinds of maps are also called Dynamic Cross Correlation maps(DCCM).
What is correlation?
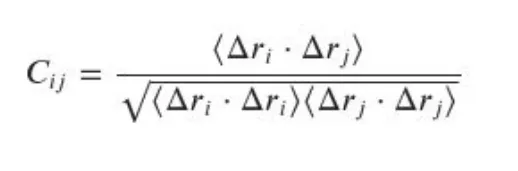
The above equation stands for the correlation equation. The above equation represents a normalized dot product but averaged over many frames. Let me explain it to you in a simple way.
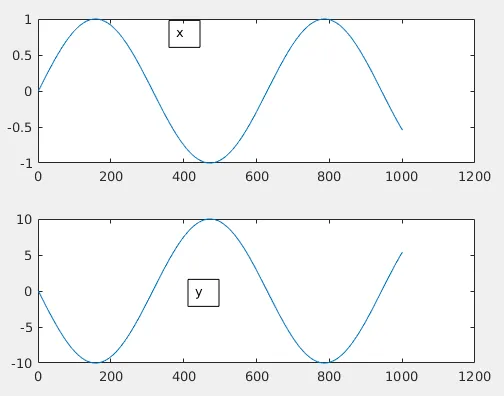
Rather than going mathematically, let me try to explain things visually. Let us imagine there exists 2 "signals" x and y. They vary like below for 1000 seconds.
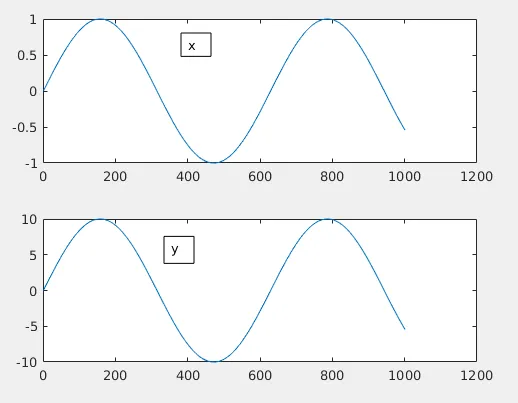
Both x and y here are identical other than a 10 times amplification for y.
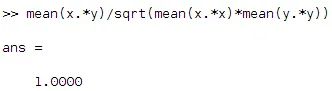
Now just by observing we find that both x and y fluctuates identically if you neglect the absolute values. As x moves up y do the same and when x moves down, y does the same. So we need a high value for this situation which means high positive correlation. Also, normalized values are useful here. So now let us plug the above equation in Matlab:
Let us do the same with x versus -y.(y flipped)
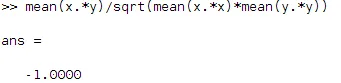
See we ended up with negative correlation, all because of the sign change! When x goes up, y goes down etc!
What if x and y are random gaussian noise?
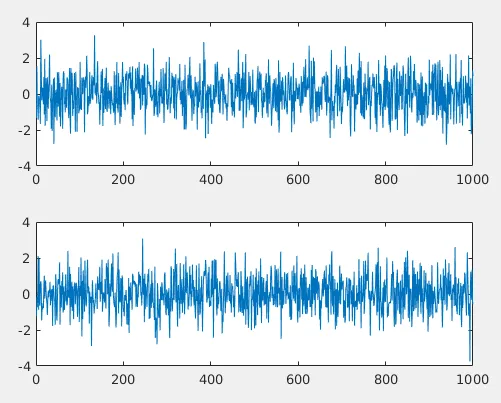
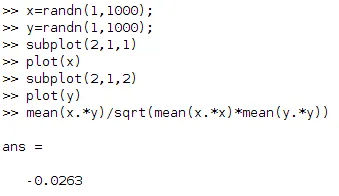
See the correlation coefficient is near to zero! Which means x and y are not correlated.
CAVEATS IN INTERPRETING CORRELATION:
Correlation of x and y = 1 doesn't necessarily tell anything between the relationship of x with y or otherwise. It just says that as one changes other follows it. x and y can be independent processes altogether. You cannot infer causation from correlation. You have even a dedicated wiki article on this particular topic. Because both values are changing in a similar fashion doesn't say that one follows other etc. Maybe it is a mere coincidence.
Translating the above concepts to protein trajectories
Say I have 100 residues in our protein. And we are considering last 1000 frames(say 10ns data) of MD trajectory.(Don't forget to fit the trajectory.) For simplicity, we are only considering alpha carbon atoms of each residue. Also, calculate the coordinates of all carbon alpha atoms. This averaged structure will be the reference structure.
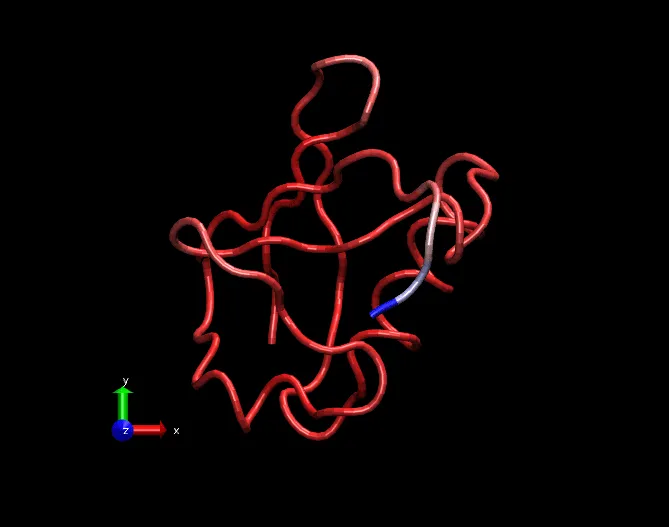
A fitted trajectory with only carbon alpha atoms. Visualization using VMD software.
Now again let us revisit the equation:
Deltas imply the difference in coordinates' values(xyz coordinates) between each frame with the averaged reference structure. The <.> symbol stands for the averaging across the 1000 frames. The i and j stands for the number of residues(in the example I mentioned 100). This will be for x,y, and z coordinates will be averaged. And let us look into the above-mentioned correlation map:
A typical correlation map. Ref:Yesudhas D, Anwar MA, Panneerselvam S, Durai P, Shah M, Choi S (2016) Structural Mechanism behind Distinct Efficiency of Oct4/Sox2 Proteins in Differentially Spaced DNA Complexes. PLoS ONE 11(1): e0147240. https://doi.org/10.1371/journal.pone.0147240. License:CC Ver 4
- The first point to note is that all diagonal elements must +1. (reddish) Why? Because diagonals represent self-correlations. residue 1 with 1, 2 with 2 and so on. Those correlations must be +1.
- That means diagonal entries carry no information in a normalized correlation map. But if you haven't normalized the covariance matrix, sqrt(diagonal elements) will give you RMSF plot.
- Now the important thing in this map is to scan for places which exhibit positive and negative correlations. This can give some intuition to the processes happening in the protein/protein-complex. Like by inferring how one region moves as another moves. Are they moving in a synchronous way? Which can be an indication of strong non-bonded interaction between 2 regions in protein.
A tool for easily calculate correlation maps etc
You can use carma/grcarma software which calculates correlation maps (among other quantities) from DCD trajectories. Link here: https://utopia.duth.gr/glykos/Carma.html
Conclusion
So we learned how to interpret correlation maps in MD papers. Also, we focused on the point not to infer causality from correlation.
References:
My previous posts:
To learn about VMD and PDB file format, see here:
- https://steemit.com/steemstem/@dexterdev/visualizing-bio-molecules-in-computer-part-1-let-us-inspect-a-pdb-file-and-see-it-using-vmd
- https://steemit.com/steemstem/@dexterdev/visualizing-bio-molecules-in-computer-part-2-introduction-to-tcl-scripting-environment-in-vmd-1-sbd-prize-task-inside
To learn about the concepts in All-atom molecular dynamics see articles below:
- https://steemit.com/steemstem/@dexterdev/classical-molecular-dynamics-series-part-1-the-fundamentals
- https://steemit.com/steemstem/@dexterdev/classical-molecular-dynamics-series-part-2-the-force-field
- https://steemit.com/steemstem/@dexterdev/classical-molecular-dynamics-series-part-3-solving-the-molecular-dynamics-equation
To setup and run simulations in NAMD software, see below:
- https://steemit.com/steemstem/@dexterdev/classical-molecular-dynamics-series-part-4a-let-us-setup-a-simulation-and-run-it
- https://steemit.com/steemstem/@dexterdev/classical-molecular-dynamics-series-part-4b-running-small-systems-on-your-computer
- https://steemit.com/steemstem/@dexterdev/let-us-cool-dmpc-bilayer-lipids-an-18-day-long-molecular-dynamics-experiment-on-hpc-facility
Textbook references for learning theory of Molecular Dynamics:
- "Statistical Mechanics: Theory and Molecular Simulations" by Mark E. Tuckerman
- "Molecular Modelling: Principles and Applications" by Andrew R. Leach
- "Computer Simulation of Liquids" by D. J. Tildesley and M.P. Allen
References specific to NAMD and VMD:
Research paper(for the example Correlation map)
#steemSTEM
#steemSTEM is a very vibrant community on top of STEEM blockchain for Science, Technology, Engineering and Mathematics (STEM). If you wish to support steemstem visit the links below:

Quick link for voting for the SteemSTEM Witness(@stem.witness)
Delegation links for @steemstem give ROI of 65% of curation rewards
(quick delegation links: 50SP | 100SP | 500SP | 1000SP | 5000SP | 10000SP).
Also visit the steemstem app here: https://www.steemstem.io
Follow me @dexterdev
 ____ _______  ______ _________ ____ ______
/  _ /  __\  \//__ __/  __/  __/  _ /  __/ \ |\
| | \|  \  \  /  / \ |  \ |  \/| | \|  \ | | //
| |_/|  /_ /  \  | | |  /_|    | |_/|  /_| \//
\____\____/__/\\ \_/ \____\_/\_\____\____\__/

credit: @mathowl
Bye for now people! STEEM ON!
Have a happy holiday season