So on my previous post about this subject I got a comment from @alexs1320 where he asked for me to do a histogram of the distribution of the steempower amongst other items of business. So what I am going to do is provide the source code for actually doing it
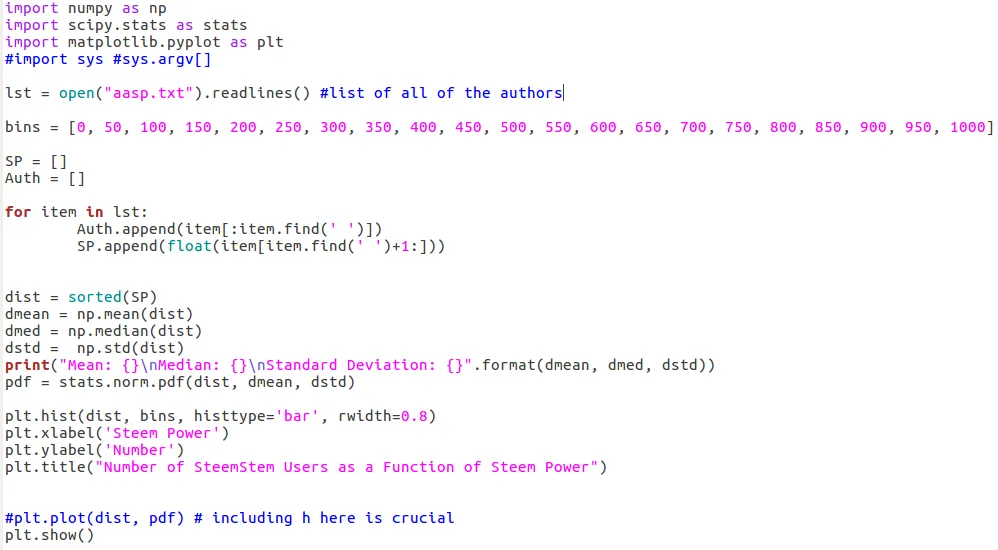
All of the analysis have been calculated off of variations of this code.
Mean: 1107.9996398406295
Median: 75.9322047099908
Standard Deviation: 5390.694061529243
Above is the output within the console and forthose without a background I will explain this briefly. The mean (average) is taken from the sum of all of the SP of steemstem community members (including curators) and dividing it by the number of members. Mean is also known as average. The median is the number that sits in the middle of the pack. So if you had a list of numbers (1,2,3,4,5) then the median would be 3. So if you have a high mean but a low median it can say a few things about your data depending on the situation. In our situation it means that half of the steemstem community members have less than 76 Steem power. Just for curiosity sake, the sum of everything before the median comes out to 7,407.754 SP and after that point comes out to 585,372.053 SP but lets show you guys something that better represents the information.
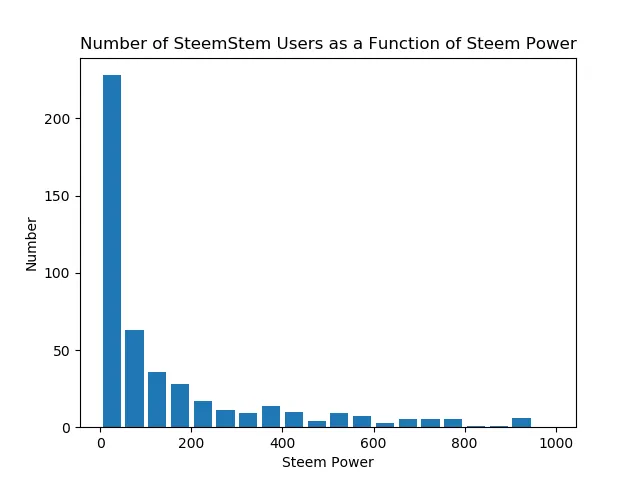
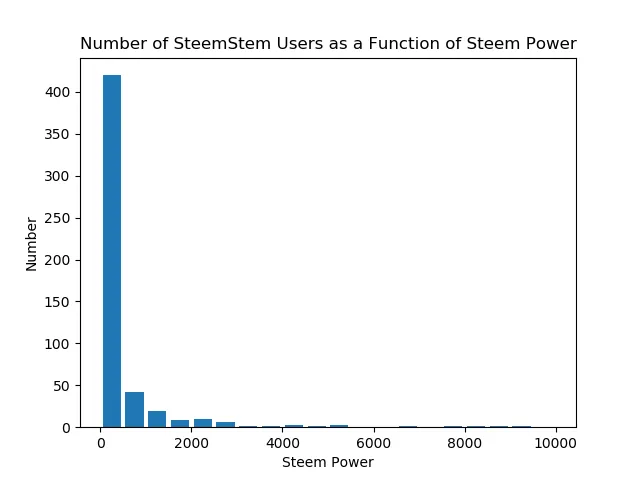
The first histogram shows the distribution of users in groups of 500 steem power, the second one shows the distribution in terms of 50 steem power. Now what that means (for the groups of 50 SP) is that all of the users with between 0 and 50 SP will be counted and tallied into the first bar, if they have between 50 and 100 then they go to the second, and so on.
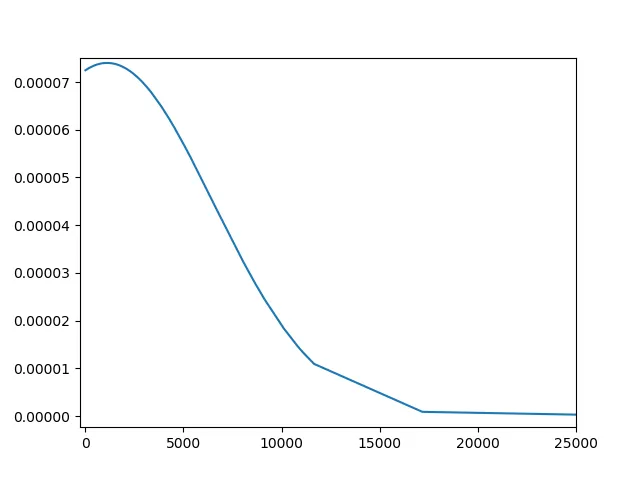
This, on the other hand, shows the normal distribution of wealth within the steemstem community. This is where we include a standard deviation of 5390.694 SP. What this means is that given a population (steemstem community) you can take the distribution of everything and it can give you some information. For instance, around 68-70% of the population will be within +/- 1 standard deviation of the mean. For this you can basically ignore the numbers on the left (y-axis) and just pay attention to the bottom. You see if we were to pick a person at random, the chance of them having 5000 SP or greater would equal to the area under the curve from x=5000 to infinity and the chance that they would have less than 5000 SP would be equal (in this case) to the area under the curve from 0 to 5000. I know that will mean nothing to non-math people but if you do like math then that will be an interesting fact. This is also a technique used for loot generation in video games along with many other uses. In other words, distributions hold an importance for statistics but most of us likely won't care about any of this.
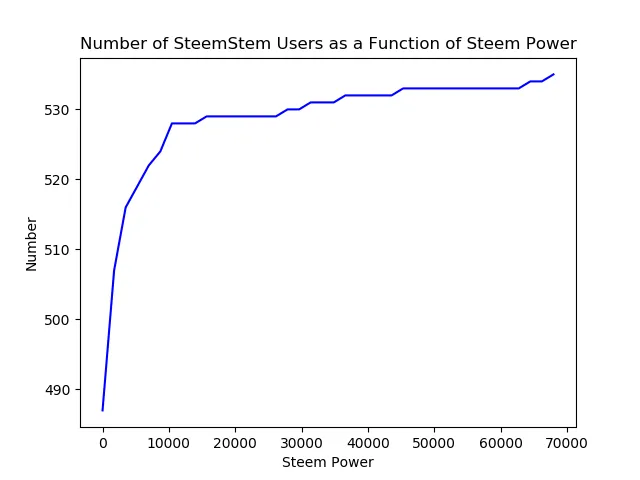
And this is the cumulative sum which has other probabilistic functionality like if you wanted to find the probability that someone has X steem power or less (if chosen at random) then the probability will be equal to the area under the curve from 0 to X over the area under the curve from 0 to the final value.
References
Data
All data has been received from the blockchain and the steemstem distilled posts.Libraries
numpy
steem-python
matplotlib
scipy
Information
Not going to lie, I didn't spend time looking for any specific resources here. I would but school is busy and this isn't exactly one of those posts that I am editing, writing and posting day of.
Wikipedia
Standard Deviation
Median
Mean
Normal Distribution
Histogram
Cumulative Distribution