Winjupos and Processing Jupiter Images
Jupiter has a complex series of cloud bands that race around the planet at different speeds. This animation shows Jupiter viewed at a fixed System II longitude (I discuss this in the text below) and was generated by the author using data from the Cassini mission and Blender. Data Credit: NASA/JPL/University of Arizona
One of the most rewarding objects to observe in the sky is Jupiter, and right at the moment, the planet can be seen to advantage in the late evening sky. I wrote recently about Jupiter in this recent blog post. It might come as a bit of a surprise that amateur astronomers can assist professional astronomers and space missions by monitoring the Planet's atmosphere. In this article, I will give a taste of the types of observations that can be made using an amateur level telescope and some free but powerful software called Winjupos.
Just recapping, Jupiter has a diameter of 140,000km making it well over ten times the width of the earth. It rotates so fast that planet bulges noticeably at the equator, and a day on Jupiter is just 10 hours. Because of Jupiter’s size, it shows the largest apparent diameter of any planet as seen from the earth except for Venus for a few days around inferior conjunction. These means that it is the easiest planet to resolve detail on and even amateur astronomers can image features as small as 1000km (Hubble can see details down to 300km). In fact, observations by amateur astronomers are often used to assist professional astronomers.
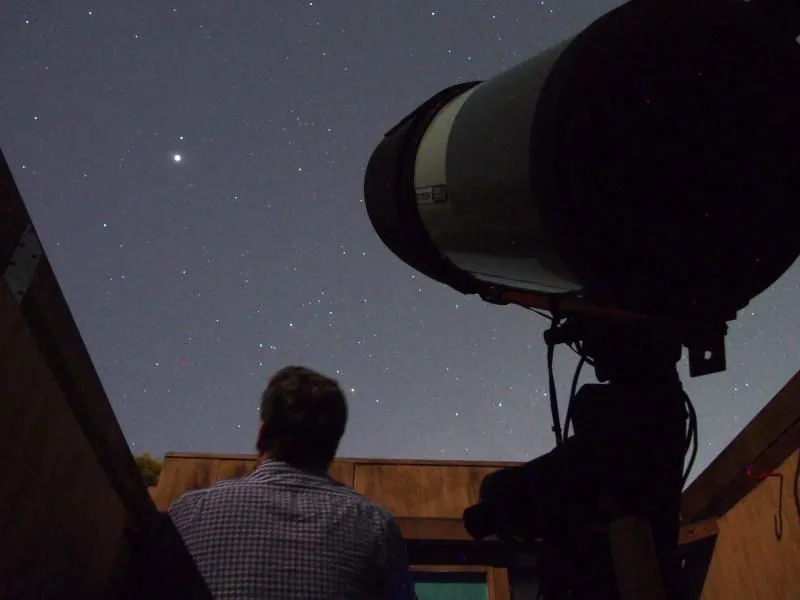
Admiring Jupiter (the bright star) over in the east from my backyard. The telescope is a 36cm diameter Celestron and was used to capture many of the images in this article
Cloud Features
Jupiter does not have a solid surface unless you go very deep into it's interior so what is visible are the cloud tops. These cloud top's reveal intense weather systems with massive storms and powerful winds undisturbed by friction from landmasses. The clouds organize themselves into bands and zones according to latitude, which is evident in the following image. There is a somewhat cumbersome naming convention that goes along with this, for instance, there is a South Temperate Belt (STB), a South South Temperate Belt (SSTB) and finally a South South South Temperate Belt (SSSTB)! Because of this, only the more significant features are shown here to avoid confusion.
Jupiter's main zones and belts are shown here. This animation shows Jupiter viewed with the System II longitude fixed and was generated using data from the Cassini mission. Data Credit: NASA/JPL/University of Arizona
The North and South Equatorial Bands
The most prominent feature visible in a small telescope on Jupiter is the North and South Equatorial Bands, which have been given the designations NEB and SEB. Appearing as a pair of mauve/orange stripes across Jupiter's creme colored disk these are constant features of the planet although they do wane and ebb in prominence over the years.
Between the North and South Equatorial Bands is the Equatorial Zone (EZ) which races around the equator with speeds up to 500 km/hr. In animations, it appears like a conveyor traveling rapidly relative to the surrounding regions. The Equatorial zone is believed to be high altitude Ammonia clouds leading to its light color, while the Equatorial Bands on either side are clear of high altitude cloud, so we look deeper into the atmosphere.
The origin of the pastel colors is probably a result of ammonium hydrosulfide or ammonium sulfide that is present in small quantities in the mostly Hydrogen and Helium atmosphere.
The Great Red Spot
No doubt the most famous Jovian feature would be the Great Red Spot (GRS) an enormous storm that has raged for centuries, and likely formed before the invention of the telescope. Somewhat surprisingly, it is not that conspicuous in a small telescope, maybe because it's color has paled slightly in recent times. It has also shrunk considerably in size in the past few decades. Despite this, it is still a formidable feature larger than the earth.
The Temperate Zones and Belts
The Temperate Belts appear to display less activity but are in no way less impressive than the equatorial regions. For instance in the South South Temperate Belt features many white Ovals which are anti-cyclonic systems, some of which have been known to last several decades.
The Polar Regions
The polar regions are quite difficult to observe from earth because we can only see them at a very shallow angle. One of the primary objectives of the recent JUNO mission was to find Jupiter's polar regions.
Summary of Features
Jupiter's Atmosphere contains many different types of observable phenomena. Observations of the size, color, and movement of these features are encouraged by amateur astronomers. Here are some examples:
| Feature | Image | Description |
|---|---|---|
| Belts | 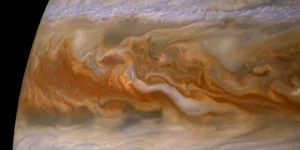 | These are regions that are relatively warmer and are free of high altitude clouds allowing views to the colorful troposphere underneath. Sulfur or Phosphorus compounds may be responsible for the coloration. |
| Jets | 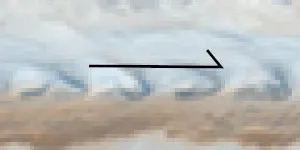 | Jets and Jetstreams can be seen at the boundary of belts and are high velocity |
| Zones | 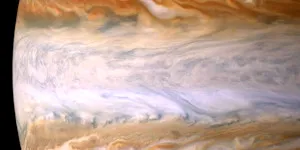 | These are light bands consisting of high Altitude clouds of white ammonia |
| Cyclones | 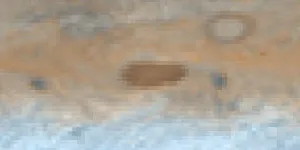 | These are smaller dark objects and often manifest as elongated brown ovals or barges |
| Anti-Cyclones | 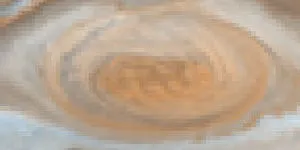 | The white ovals and Great red spot are anti-cyclone vortices where wind speeds have been estimated at 600 kph. These features can last many years (centuries in the case of the Great Red Spot) |
| Impacts | 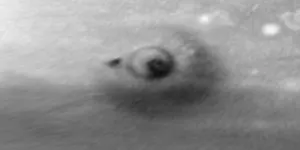 | Every few years an impact is observed that can leave a dark marking on the planet, all of the recent impacts have been found by amateur astronomer's who constantly monitor the planet |
Image Credits: NASA/JPL-Caltech/Space Science Institute
Winjupos
Winjupos is an excellent free application available that provides cartography functions for planetary images. Data obtained from Winjupos can be used to track Jupiter's features. Here is an example of how it can be used.
You can download and install Winjupos from here.
Making Jupiter Observations
Latitude and Longitude is a non-trivial matter on Jupiter. Unlike on earth, there is no surface, and the visible cloud tops travel at different speeds relative to one another, so longitude is challenging to define. Luckily, latitude is relatively fixed since there is a clear rotational axis in the clouds. In the end, astronomers have come up with three separate longitude references called system I, II and III. These systems are defined as follows.
| Longitude System | Defined By | Period |
|---|---|---|
| I | The mean motion of the Equatorial Zone, a zone of fast moving Ammonia clouds | 9h 50m 30s |
| II | The mean motion of much of the remaining Jovian clouds, like the Great Red Spot | 9h 55m 41s |
| III | Magnetosphere, Official rotation | 9h 55m 30s |
When making observations of Jupiter, it is normal to specify Central Meridian, for all three longitude systems. The central meridian is the longitude most central on the planet at the time of observation. Winjupos assists in this process and enables the following example output.
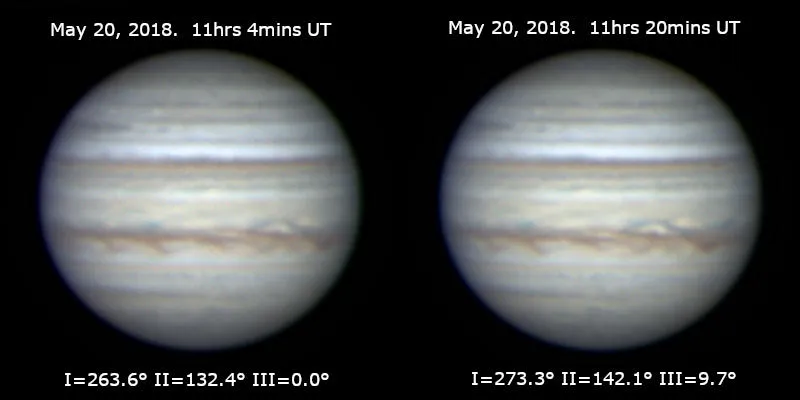
Winjupos has been used to calculate the Central Meridian in System I, II and III longitudes in these images.
In addition to computing the central meridian, Winjupos also determines data such as the orientation of North/South, image scale, and limb darkening. This information enables some exciting applications to performed including derotation and mapping. Let's look at the functions.
De-rotation
High-resolution imaging of Jupiter will clearly show the planet's rotation in less than a minute. In previous articles, I discussed the benefits of stacking and with Jupiter best resolution might require up to 30 minutes of exposures. In this time the planet will have rotated significantly, causing detail to be blurred as shown n the following left-hand image. Winjupos, can compensate for this and de-rotate the images as seen at the right.
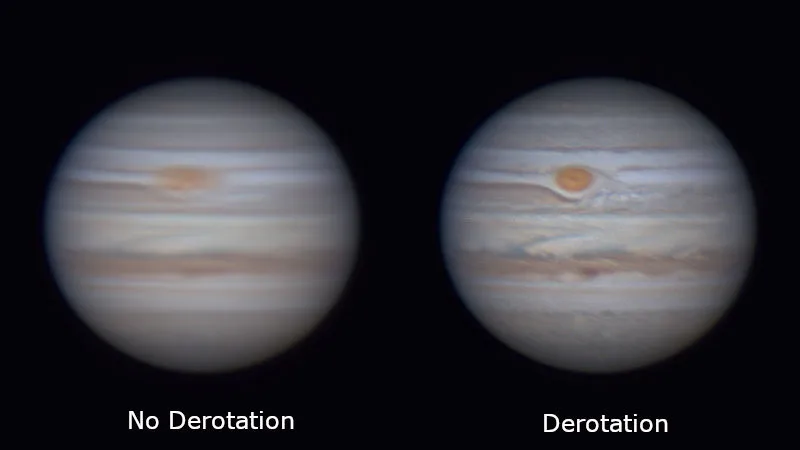
The image below left, is the result of stacking 18 minutes of video of Jupiter. The planet appears blurred from it's rotation. However, when Winjupos is used to de-rotate the image stack a much sharper result is possible (as seen on the right). Credit:Author
Mapping
Another fascinating application of Winjupos is the ability to render planetary images in some different projections. Here is an example of images of Jupiter from May 18 and May 19, 2018, unwrapped in a cylindrical projection. Winjupos is an excellent tool for monitoring changes in a planetary atmosphere. Btw if you want to know more about different mapping projections, please head over to @lordneroo 's blog here.
As an interesting exercise, I was able to get two consecutive nights with good conditions and was able to obtain images of the same part of the planet 21 hours apart. These observations enabled the measurement of the movement of some features in the cloud-tops. Here is an example of a calculation of wind speed computed for a jetstream jet from these two nights of observations.
Observation from May 18,2018
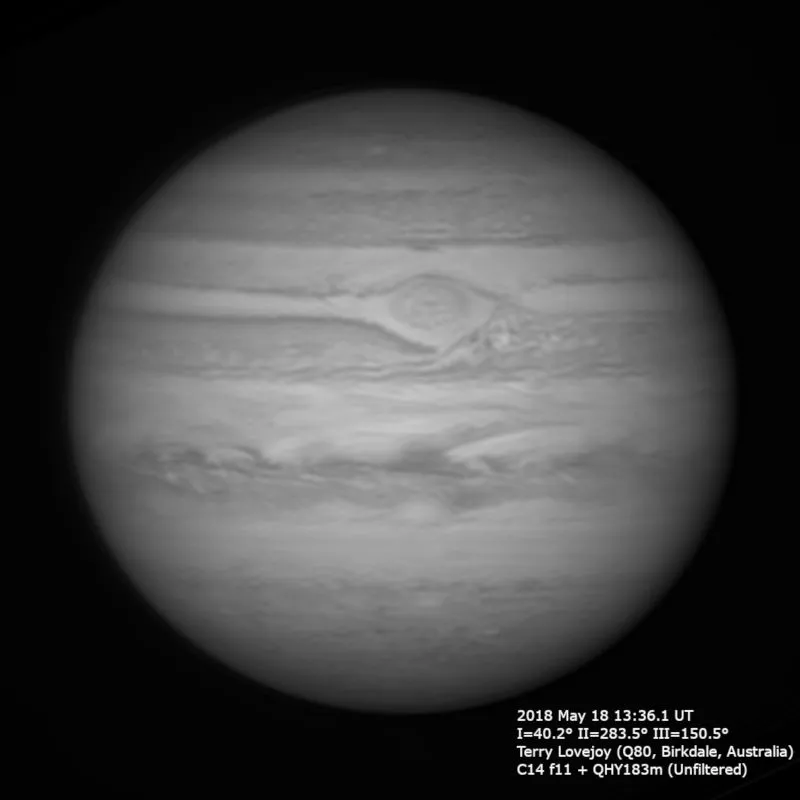
Direct image of Jupiter in Winjupos on May 18, 2018 (13hrs 36mins UT). Image Credit: Author
Using Winjupos to project this image to a cylindrical projection.
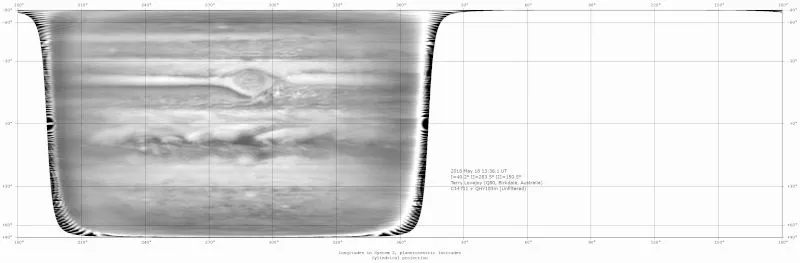
Cylindrical projection of Jupiter in System II longitudes using Winjupos of image above on May 18, 2018 (13hrs 36mins UT). Image Credit: Author
Observation from May 19, 2018
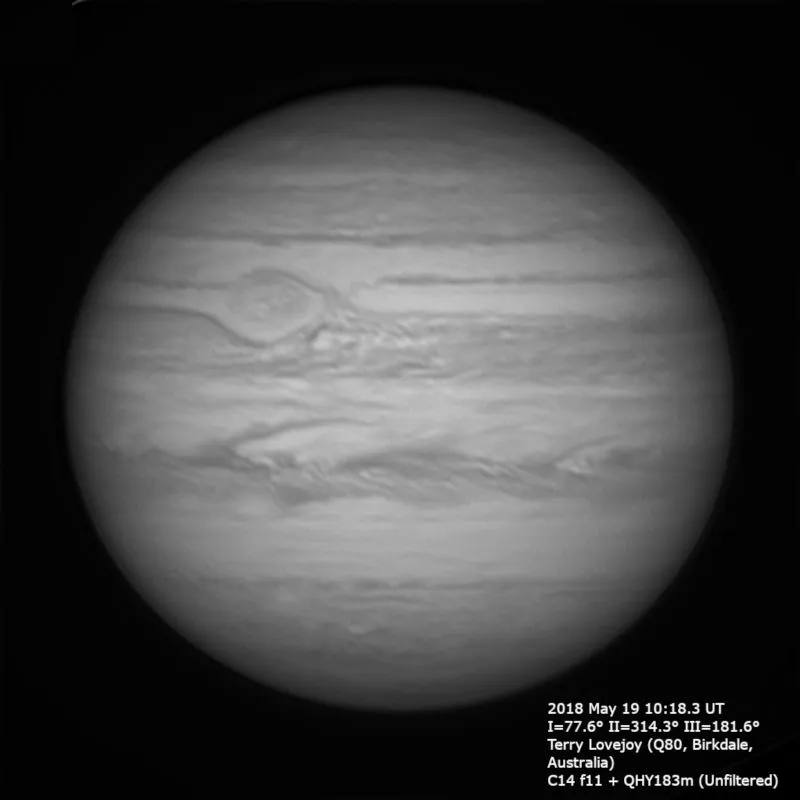
Direct image of Jupiter in Winjupos on May 19, 2018 (10hrs 18mins UT). Image Credit: Author
Using Winjupos to project this image to a cylindrical projection.
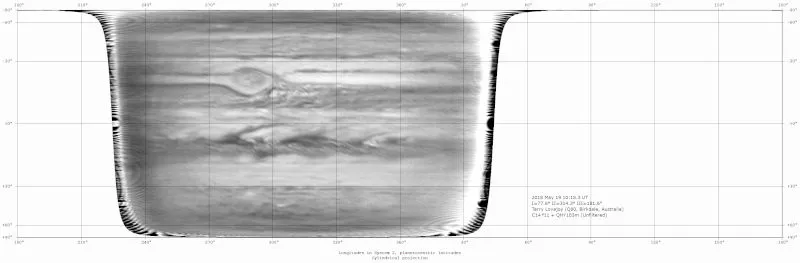
Cylindrical projection of Jupiter in System II longitudes using Winjupos On May 19, 2018 (10hrs 18mins UT). Image Credit: Author
A prominent chevron shaped feature was identified in the jet stream on the boundary of the North Equatorial Belt as shown in the following images. Using Winjupos the longitude and latitude of the point of the chevron were determined.
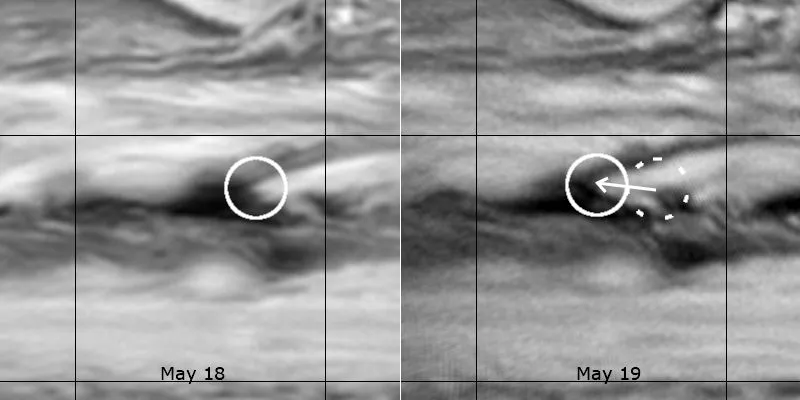
Enlargement from the May 18 and May 19 images above, showing a feature in the Equatorial zone that has moved a distance of 8500km in 21 hours
Here are the observations.
Observation 1:
Time: May 18 13hrs 36mins
Longitude (System II): 291.3° (Measured from Winjupos)
Latitude : 6° North
Observation 2:
Time: May 19 10hrs 18mins
Longitude (System II): 284.4° (Measured from Winjupos)
Latitude : 6° North
Here are the calculations.
Using an approximate radius of Jupiter of 70,000km, and assuming this feature is on the equator, the actually actual data computed is as follows:
Movement in Longitude = 291.3 - 284.4 = 6.9°
Movement in km = 6.9° x (𝜋 / 180) * 70,000km = 8,430km
Time Duration between observations = 20.7 hours
Computed Wind velocity = 407 km/hr
This value is definitely in the ballpark of quoted figures which state that wind speed is up to 500 km/hr.
Conclusions
Jupiter has a fascinating weather system that can be observed in extensive detail even by amateur astronomers from the suburbs. If you get a chance go point, even a small telescope, towards Jupiter as rises in the east these May evenings.
References
- Gray, Bill. Formula for Jupiter's Central Meridians and Great Red Spot Transits. Accessed May 23, 2018. https://www.projectpluto.com/grs_form.htm.
- A Guide to Jovian Activity. Accessed May 23, 2018. http://www.britastro.org/jupiter/guide.htm.
- Where Did You Get Those Stripes? Accessed May 23, 2018. https://www.nasa.gov/centers/goddard/multimedia/largest/atmosphere.html
- Jupiter’s Great Red Spot: A Swirling Mystery. Accessed May 23, 2018. https://www.nasa.gov/feature/goddard/jupiter-s-great-red-spot-a-swirling-mystery
- Zenographic longitude systems and Jupiter's differential rotation. Accessed May 23, 2018. http://rsnr.royalsocietypublishing.org/content/55/1/69
- Jupiter's Jet Streams. Accessed May 23, 2018. https://svs.gsfc.nasa.gov/10981
- NASA Juno Findings - Jupiter’s Jet-Streams Are Unearthly. https://www.nasa.gov/feature/jpl/nasa-juno-findings-jupiter-s-jet-streams-are-unearthly
- Rogers, John H. The Giant Planet Jupiter. Cambridge: Cambridge University Press, 2009.
Please note all images are the authors (unless otherwise noted)