I have witnessed a lot of arguments and debate in my day to day interaction with people. While some sound so 'Nobel Laurate' like, others sound like a broken record for stupidity. Just imagine someone approaches you, opens his/her buccal cavity and tells you that 2 is not greater than 1. What would your reaction be?
If time travel were to be real and I am able to make a journey to 15 years back, my reaction would have been to recommend such person as the prince of stupidity. However, my learning through school and more specifically, statistical knowledge tells me that 2 might indeed not be greater than 1. I know you are waiting to know 'how'?

Scientific method revisited
We all know how important data are when it comes to science and scientific research. Without data, there is no research and without researches, the majority of technological and scientific breakthroughs that we have today would never have happened. Scientific research starts with hypothesis (a generalized, yet to be proven statement) after researchers must have ganered some background information on a particular phenomenon.
The research continues with the testing of hypothesis. In natural and applied science, hypotheses are usually tested using well designed field or laboratory experiments (administration of questionnaire inclusive in some cases) during which relevant data are collected. In social sciences, data are usually collected primarily through the adminstration of questionnaires. It is however important to note that data for hypothesis testing can also be obtained from secondary or tertiary sources, either solely or in addition to the primary data collected by the researchers.
Data in raw forms are more or less useless for hypothesis testing. Hence, some form of organization and arrangement must take place. Data collected on the field or in the laboratory can be organized into tables of frequecies or percentages or pictorially represented in form of pie charts, bar chats, histograms, line graphs or clustered diagrams. As such, trends or meanings can be seen from mere visualization of the tables or pictogram. This is otherwise known as data analysis.

Data analysis and statistical analysis often go hand and hand in most cases and distinguishing them might be a bit difficult. According to Norah Wulff, a Data Architect;
The difference between statistical analysis and data analysis is that statistical analysis applies statistical methods to a sample of data in order to gain an understanding of the total population. Whereas data analysis is the process of inspecting, cleaning, transforming and modelling available data into useful information that can be understood by non-technical people.
She went further to explain that;
The process of data analysis can be used as an input into performing statistical analysis, as data from various sources can be combined in order to conduct statistical analysis. source
Statistical data analysis
Usually in most cases, in order to arrive at a reasonable conclusion concerning the hypothesis, the collected data are subjected to statistical analysis. The analysis puts meanings and coherence in a set of figures that could be meaningless and incoherent at a glance. There are two aspects of statistical data analysis:
- Descriptive statistics
- Inferential statistics
From the word 'description', descriptive statistics is an aspect of statistical analysis that seeks to describe the relationship that exist between variables measured during experiments as well as summarise a large chunk of data into easily relatable forms such as range, mean, mode, median, variance, standard deviation, mean deviation and so on. These statistical forms are generally refered to as measures of spread and measures of central tendencies.
On the other hand, inferential statistics is a branch of statistical analysis that seeks to draw conclusion from a population based on the data collected from a sample of the population. It is almost impossible to conduct a research on an entire population, hence, a portion of the population are usually selected as a representative of the population during research. The selected part is referred to as sample.
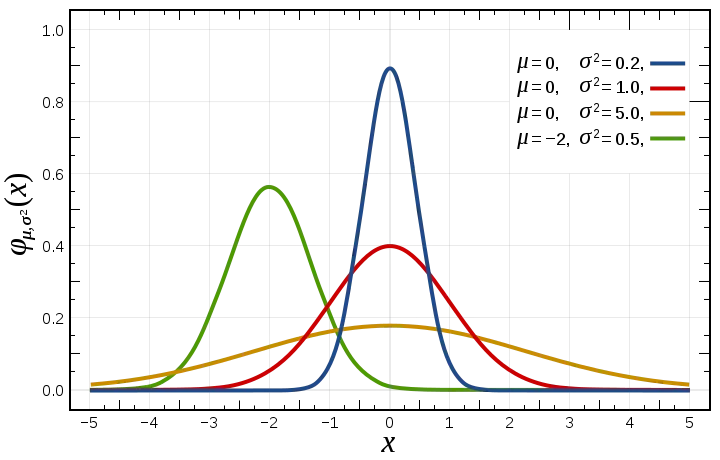
In order to subject a data set to inferential statistics, some basic conditions have to be fulfilled. One of such conditions is that selection of samples (from which data is obtained)from the population of interest must be randomized in order to eliminate all elements of bias. In addition, variables measured during data collection must be measured in replicates depending on the kind of inferential statistics the researcher intends to subject such data to. Also, data for inferential statistics must always be normally distributed and devoid of skewness.
Frequency analysis and significance testing: a situation of is 2 really greater than 1?
There are different statistical parameters that can be used to derive inference from data obtained from populations of interest. These include frequency analysis and significance testing.
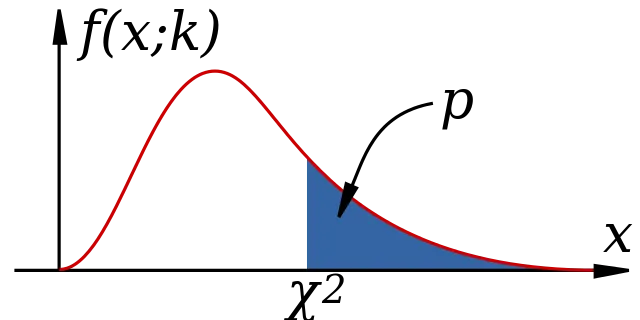
Analysis of frequencies treats on the important class of cases and tests hypothesis based on frequencies. Whenever data from a sample is classified into frequency table, the observation of the research is being reduced to counts of the number of occurences in each class and hypothesis based on such data are usually analysed using the Chi-square distribution. Such hypothesis testing procedures are analysed either by using the tests of goodness of fit method or tests of independence method.
During the tests of goodness of fit, all computed Chi-squares are cut off as goodness of fit of observed frequencies to frequencies that would be expected if such data were to be generated under some particular theory or hypothesis. For example, expected frequencies might arise from a genetic model that specifies the proportion at which various phenotypes occurs in the offsprings of a partiuclar mating. In such a case, the researcher would be interested in learning whether the observed phenotypic differences conform to the expected pattern or vary significantly from it. A good example illustrating tests of goodness of fit can be found here
In some cases during research, means of variables derived from same or different populations might need to be compared in order to arrive at an inference of whether one is significantly greater or lesser than the other. Means might be different from each other but they are as good as being the same if the difference (s) between/among them is/are not significant. Properly put, the means migh need to be analysed whether they are significantly different from each other or otherwise.
Depending on the number of means to be compared during statistical analysis, there are basically two methods available;
- Student's t-test which is usually employed when two means (paired or unpaired) are to be compared. A good example of how to compute a t-test can be found here
- Analysis of Variance (ANOVA or F-statistics) which is usually employed when more than two means are to be compared. A version of ANOVA which is known as one-way (or one factor) ANOVA can actually be applied in the case of two means comparison. Other version of ANOVA include two-ways and three-ways analysis of variance. A good example of its computation can be found here
Hence, a mean of 2 and a mean of 1 might differ in face value but statistically be the same if subjected to significance testing and found not to be significantly different from each other.
Thank you all for reading.
References
Convenient Delegation Links:


Oseni Shaid | Ambassador (Nigeria)
Email : oseni.shaid@yahoo.com

Join a community with heart based giving at its core


