The US Dollar has tilted back-towards near-term resistance after a bag of mixed European PMI's helped to hit the Euro. EUR/USD remains at confluent resistance, finding sellers in this area now for a fourth consecutive trading day.
The lone high-impact USD announcement for this week is on the economic calendar is scheduled for 10AM ET this morning with the release of ISM Non-Manufacturing/Services Composite.
US non-manufacturing industries have now seen 99 consecutive months of expansion, as indicated by a read of greater than 50. Last month, this indicator came-in at 56.8 versus an expectation of 58.2 and a prior print of 58.8. The expectation for today is 57.6.
US Dollar Holds Support, Moves Back to Confluent Resistance,
This gives us current support from 93.63-93.75 while resistance resides in the confluent are bound by two different 38.2% Fibonacci retracements from 94.19-94.30. The one high-impact US data release for this week is set to be released a little later today when ISM non-Manufacturing/Services numbers are released at 10 AM ET this morning.
US Dollar Two-Hour Chart: Bounce From Support Finds Sellers at Short-Term Resistance,
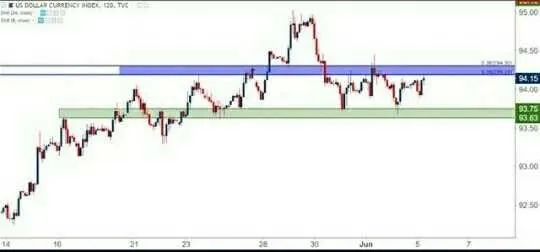
The big question at this point is whether sellers remain aggressive on a re-test of the short-term resistance that's started to come into play again.
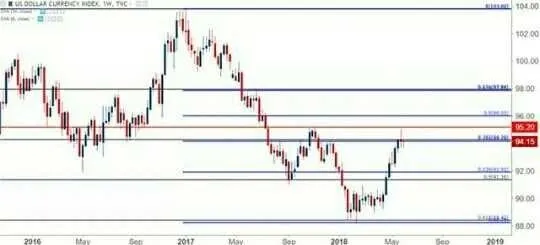
US Dollar via 'DXY' Weekly Chart: Last Week's Doji at Confluent 38.2% Resistance,
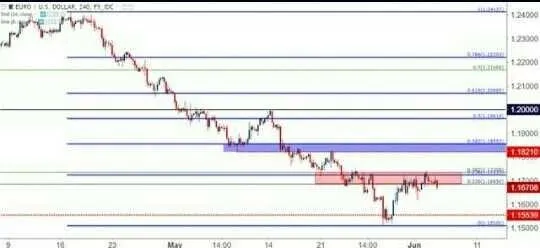
EUR/USD has held into a fourth day of trade, with sellers continuing to show in the zone that runs from 1.1685-1.1736.
EUR/USD Daily Chart: Prior Support Becomes Resistance
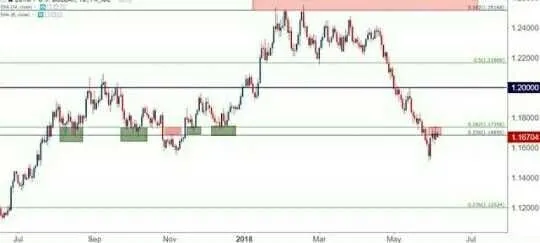
participants likely want to keep in mind the fact that bears have yet to abate as price action has posed a mere 23.6% retracement of that recent bearish trend.
EUR/USD Four-Hour Chart: Confluent Resistance Continues to Hold,
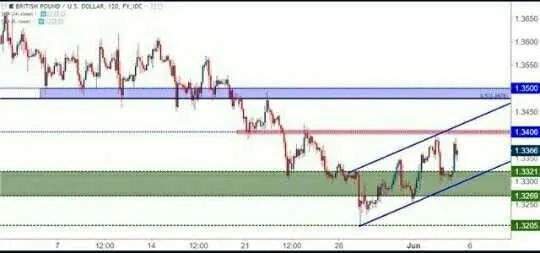
and this keeps the door open to bearish strategies in Cable, as this is one of the more attractive ways to look for a continuation of US Dollar strength at the moment.
GBP/USD Two-Hour Chart: Building Bear Flag Formation,
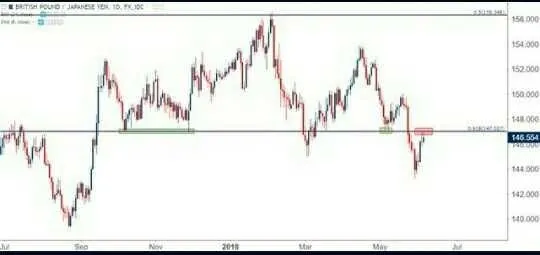
Also of interest on the short side of the British Pound is GBP/JPY. The pair has run-up to a key level at 147.03, and sellers have shown thus far.
GBP/JPY Daily Chart
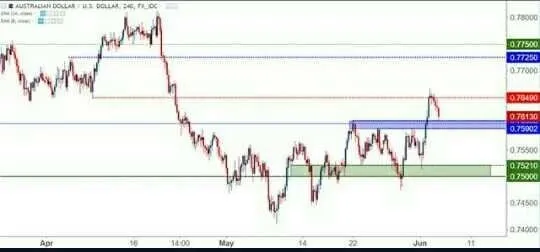
In AUD/USD, the area of interest resides around the .7600 psychological level . This is a prior swing-high, and after prices broke-through on Friday, bulls retained control until we saw resistance come-in around prior support of .7650.
AUD/USD Four-Hour Chart
But, after starting to test support a couple of weeks ago, that bearish drive slowed and, eventually, buyers began to tilt prices higher.
NZD/USD Weekly Chart: Two-Year Range Remains
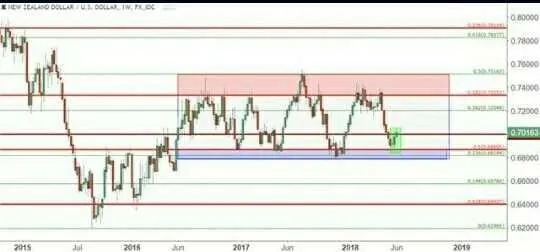
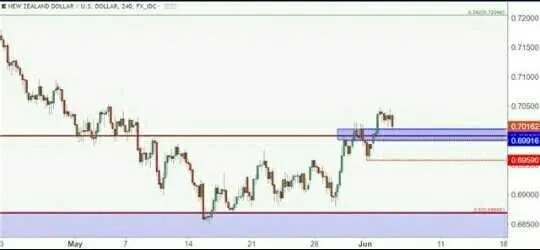
confirming that buyers will, in-fact, react. A hold of support here opens the door for stops below the prior swing-low of .6950, with targets directed towards .7100 and then the beginning of range resistance at .7200.
NZD/USD Four-Hour
The views and opinions expressed herein are the views and opinions of the author and do not necessarily reflect those of Nasdaq, Inc.
Thank..
@shintamonica...