... and TIL that I could write four times TIL in a title :)
Exactly one week ago, a new initiative was started on Steemit, about having short posts triggering discussions and fun. In the case you missed the announcement, please click here.
In the following, I focus on the TIL case and present a few statistics related to its first week of being around.

[image credits: pixabay]
TIL ON STEEMIT - HOW TO DEFINE ITS SUCCESS?
After a week, I was wondering how well was the above-mentioned initiative received by the Steemit community. There are dozens of ways to assess that, and I personally used this question as a motivation to start implementing pythonic tools to access the Steemit database and make the information I was looking for human readable.
Before going anywhere, all the results I will show here rely on the steemtools python package made by @furion and the steemdb project created by @jesta. And the last but not the least, I am personally thanking @cristi for his help on finding appropriate tools!
After thinking a bit, I think that the TIL success can be measured with three factors:
- the number of votes that shows how much users are attracted by a post;
- the number of comments that show how a post triggers discussions (which is the researched goal in the TIL case);
- the post rewards, that I do not need to comment ;)
And I will represent my findings as a function of these three factors.
STATISTICS
In order to be able to draw any conclusive statement, it is mandatory to have a point of comparison. I therefore choose to compare TIL statistics to those originating from the science category (my preferred Steemit category, with a small number of daily posts) and the photography category (one of the most popular category on Steemit).
The data includes articles posted from Nov 15th at 17:12 UTC to Nov 22nd at 17:11 UTC (i.e. a full week). This consists of:
- 245 science posts
- 1262 photography posts
- 356 TIL posts
This already shows that TIL posts are trending and receive attention from many. Good, one of the goals seems thus completed.
I will now quickly describe the TIL success in terms of the success factors defined above. As a result of the number of posts above-mentioned, care must be taken as any result will have to be attached to a rather large statistical uncertainty. We probably have enough material to get the trend, but not enough to go beyond this. My analysis is for this reason very brief.
The data of all written TIL posts can be summarized in the figure below:
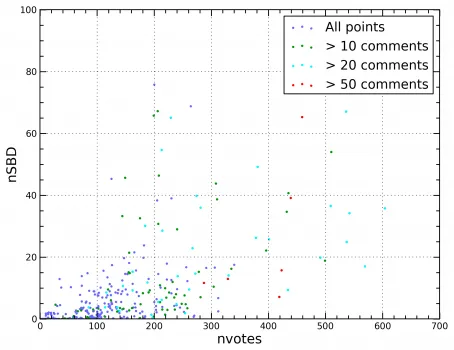
Most of the posts are located in the lower-right corner of the figure: those all correspond to:
- low-rewarded posts with a payout that is less than 5-10 SBD;
- posts with very few comments since a blue point means less than 10 comments;
- a number of votes ranging from 0 to 150.
We also have a few green and turquoise points that are representative of posts that triggered a more intense comment activity.
One important threshold is, in my opinion, the number of votes equal to 175. Above this number, most posts are connected to a larger number of comments and many got rewarded by at least 10 SBD. Would this 175 number be representative of the number of bots (or users with a bot behavior)? Possibly I would say.
From the figure, it is also clear that TIL posts in general attract many votes. However, many TIL posts are not that commented out. The number of comments seems to be only slightly correlated to the number of votes. If the latter is above 175, it is likely that the post has attracted more than 10 comments.
Finally, concerning payouts, many posts are below the 5 SBD threshold. It is difficult to assess anything concerning the posts that have been rewarded more than 5 SBD as we are missing statistics. The only thing we can say is that almost all posts that got more than 20 SBD as a reward have attracted a lot of comments.
I am afraid to draw any strong conclusion here. We probably need more statistics. But we can already get a clue about the trend. One should not conclude more, in my opinion.
COMPARISON WITH PHOTOGRAPHY AND SCIENCE
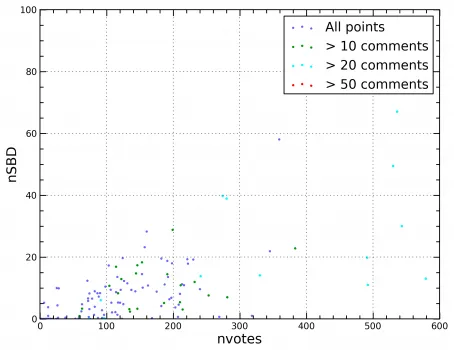

We observe (top figure) that science posts are generally not triggering that many discussions and that the payouts are half of the time below the 20 SBD line. It is however dangerous to conclude anything as we are dealing with small numbers. The distribution in the number of votes is however very similar to the TIL case.
Concerning the photography case (lower figure, with a different scale on the y-axis), we observe once again a similar distribution for the number of votes. The payouts are however this time all concentrated mostly below the 10 SBD line, with few exceptions (that are very largely rewarded). One important point here is that a good fraction of photography posts are posts that attract comments but it is rare to see more than 50 comments. Comments and number of votes seem to be uncorrelated.
CONCLUSIONS
The TIL initiative can be seen as a success since;:
- A large fraction of TIL posts are posts that get many comments, at least when compared with two other post categories.
- Rewards can be larger than in other categories, even when compared to the most popular categories. We all know why (thanks!)!
- The distributions in the number of votes seems very similar in all considered cases, which is the most puzzling result in my opinion.
Disclaimer: Will I post such a stat post everyday? No! Every week? No! I would however be more than happy to provide statistics of any kind on request (if I can code it of course) through the Steemit chat.