Hey Steemians , here is my analysis on where ETC may be headed.As always not a professional trader just sharing what i have learnt in my few months trading.
Indicators considered
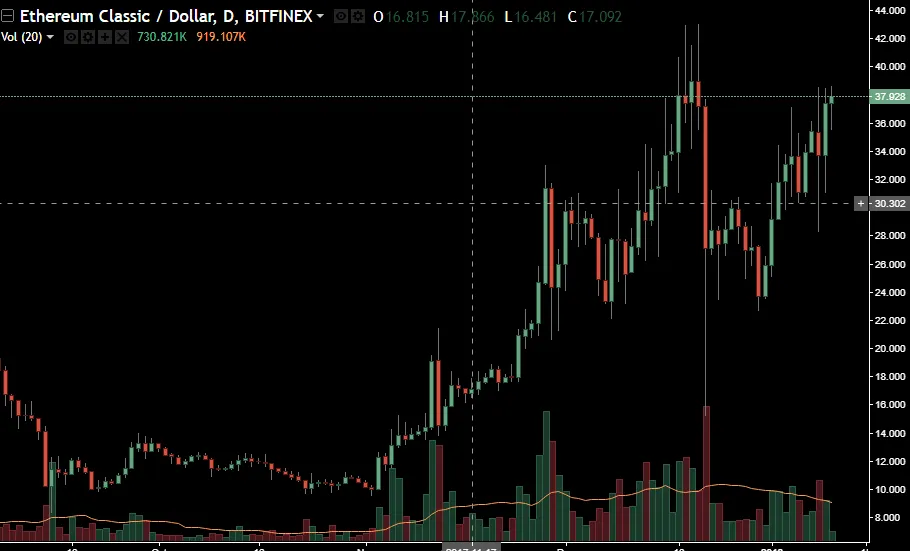
So for starter's the 24hr Volume was around 600,000,000 2 days ago and it has increased to 800,000,000
This is followed by an over all increase in the market cap as well .This is good because it provides us with an overall sense of what is happening in the markets.
Fibonacci Levels
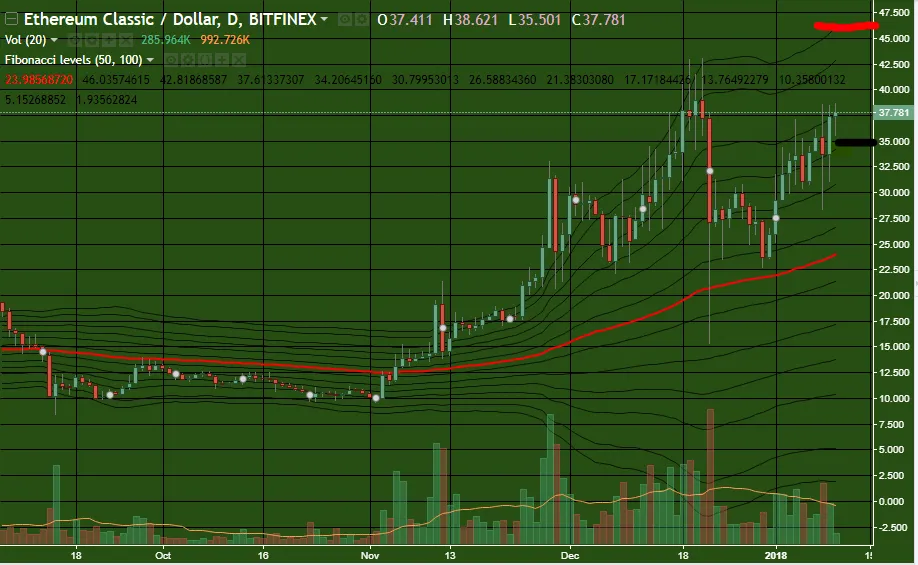
Fibonacci levels provide insights to the market particularly where the new support levels and specific resistance levels.For a long time Ethereum classic was below the 35 dollar mark which was proving to be resistance now that we are above it we should expect significant support at this level.
As you can see from the image above the black watermark is where i believe our new support has been established now and red mark is where i expect the new resistance.
MACD
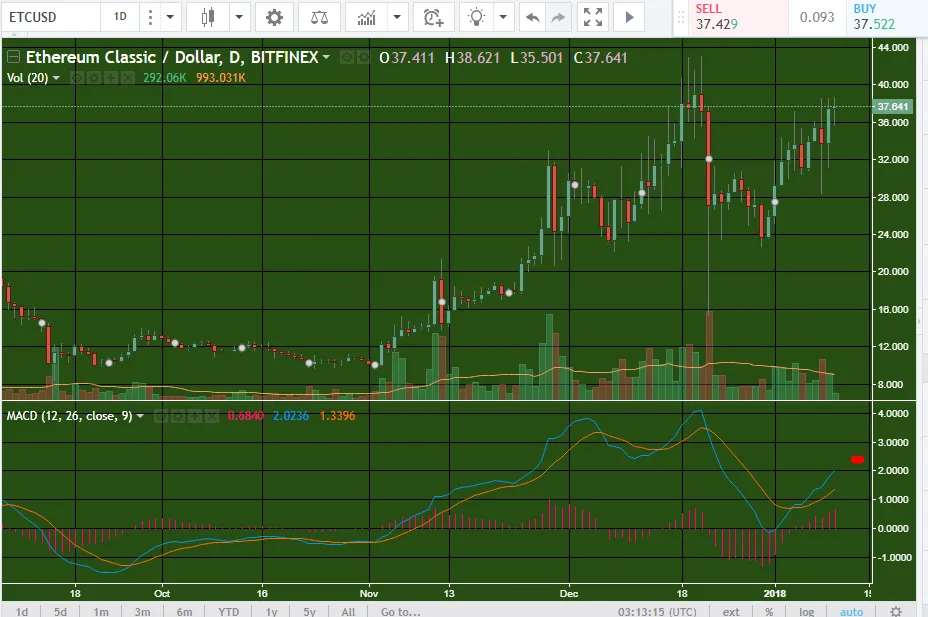
Secondly we consider MACD scale( Red watermark ) on the daily chart.
The blue line(12 day exponential moving average) is above the orange line (26 day exponential moving average).This is generally indicative of an upward trend especially when followed by volume.
Overall i expect ETC to reach a new All time high in the coming week's .It'll be interesting to see how this plays out.Feel free to ask me any questions regarding my analysis.
Binance Referral Link :https://www.binance.com/?ref=13156131