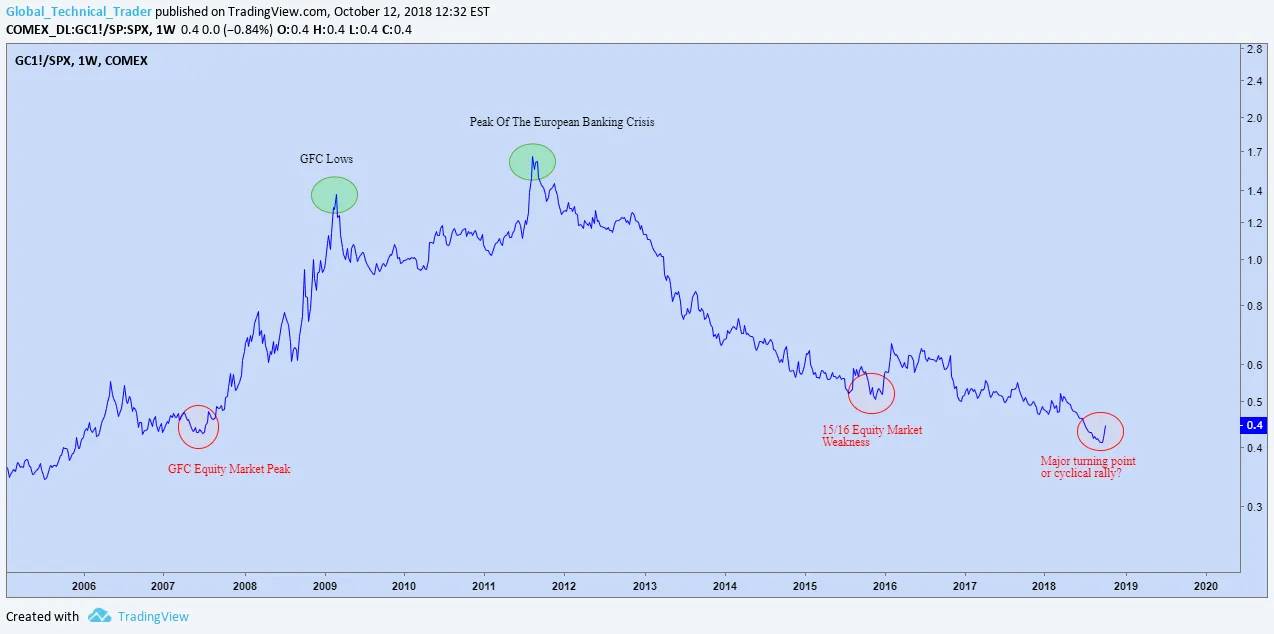
Whilst this is a far from perfect indicator, at major turning points, the ratio of Gold to the S&P 500 can give us clues to the future direction of Equity Markets.
On the above chart, I've highlighted some of the major turning points in the ratio and as can be seen, these all correspond with significant turning points in the equity market.
In 2007 the ratio began to turn higher in June, 4 months prior to the market peak in October. The resulting peak then corresponded with the GFC lows in March of 2009. The peak in 2011 lead the equity market lows by 2 months and then lastly we can see gold's strength in 2015 whilst the SPX was in a correction.
Given the recent performance in global equities and the outlook for gold, which I have analysed in detail here, the question we need to ask is have we seen a secular low in this indicator?
If so, we should be very concerned about the future direction of equity prices from here on in.