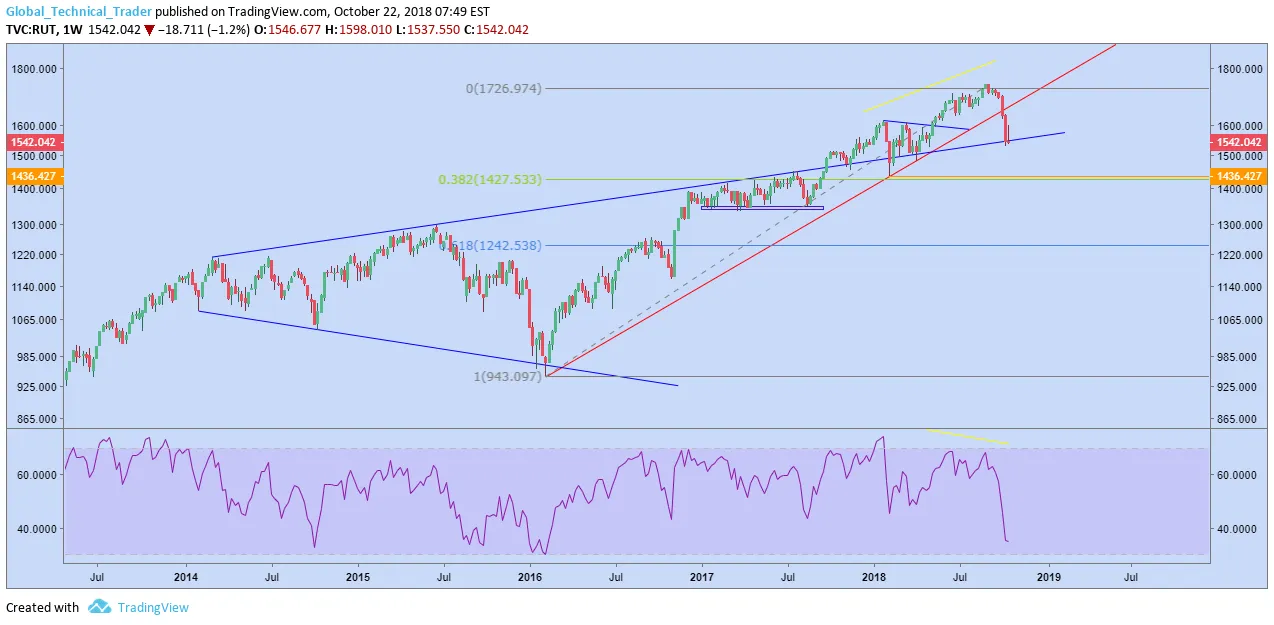
In September of last year, the Russell finally broke above the rising resistance line that had been holding back prices since March 2014. This clearly should have been viewed as a positive event and the market managed to rally over 18% from the breakout to it's recent high.
However, just 6 weeks on from that high and the uptrend has been broken and the rising resistance line which is now support, is in danger of breaking. Should support give, this represents a major failure from the prior breakout and would suggest lower prices. More to the point, given the time-frame over which the rising resistance formed, I would suggest it opens up the potential for significantly lower prices.
This is one of many charts that are in danger of a significant breakdown. I wrote here about waht AUDJPY might be telling us, but I think the Russell 200 chart is one of the most important ones to be watching right now.