If you're reading this then I probably don't have to explain what candles are or how they're formed. Open, high, low, close, up, down, all basic stuff yada yada.
Something that most people overlook though, is the open and close are just an instant snapshot of price, at the extremes of the candle timeframe. Everyone focuses almost entirely on the open and close, even giving them some special significance over what the price actually did throughout that period.
YouTube University always teaches stuff like
"go long if the next candle closes higher"
or
"go short if the candle closes in the lower half"
Where the candle closes doesn't really matter so much as where the price went to in between. Highs and Lows tell you a lot more information and are always neglected. Remember, the open or close is just a single point in time when that candle was created.
Virtually no two charts look the same, especially if they're from different brokers or different timezone. Even worse is if the data is taken from an underlying asset, like a derivative product, then that data stream could be completely different from someone else's.
This isn't just limited to candles, it's also true for all chart patterns and all indicators...
That's one of the main reason you should never follow some gurus advice if they say
"this blah blah pattern just formed on this stock, so that's a buy signal"
Unless you're looking at the same chart, from the same broker, on the same timescale, on the same platform, it's likely going to look different to you.
On to some examples...
The following charts has a classic YouTube University trading opportunity (highlighted in red).
"A pinbar/hammer formed at the bottom of a downtrend. Go long if price closes higher the next day"
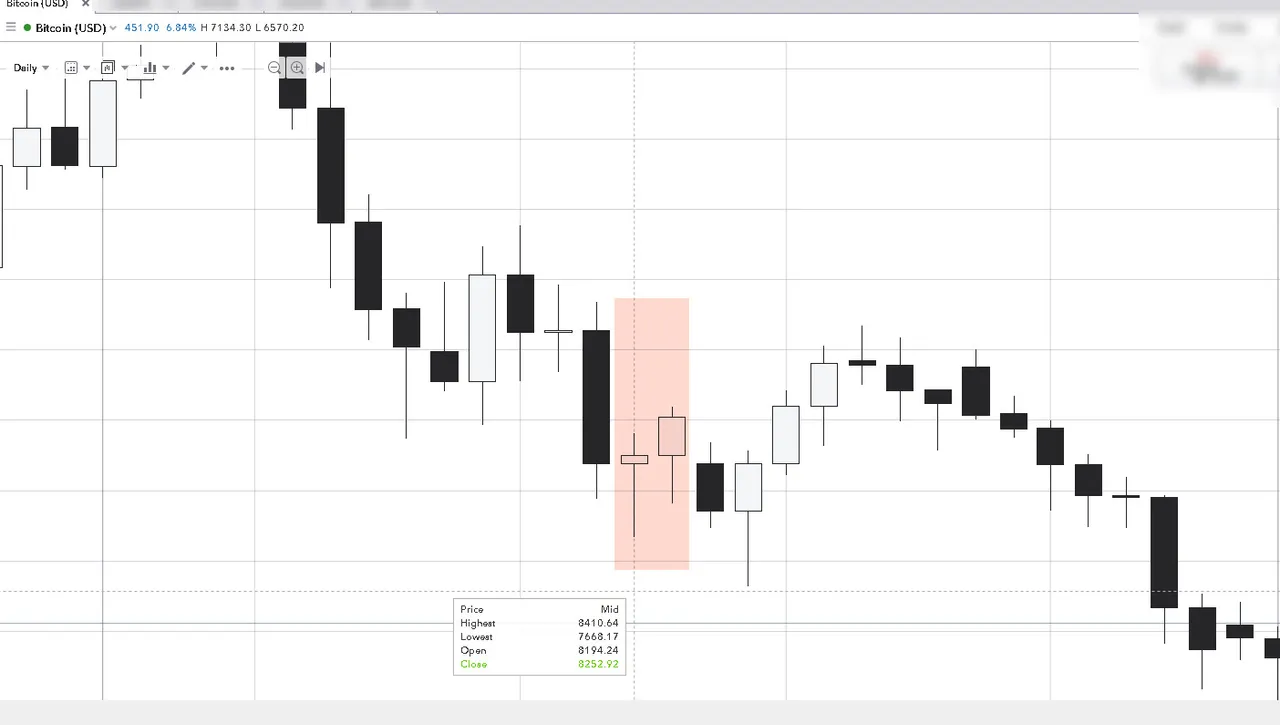
So it did indeed close higher the next day and you went long. And it was a losing trade, but that's ok, just normal business.
But look at the next chart from a different broker, the trade would never even have been triggered. Not only didn't the price close higher above the hammer, but it also formed a very indecisive doji.
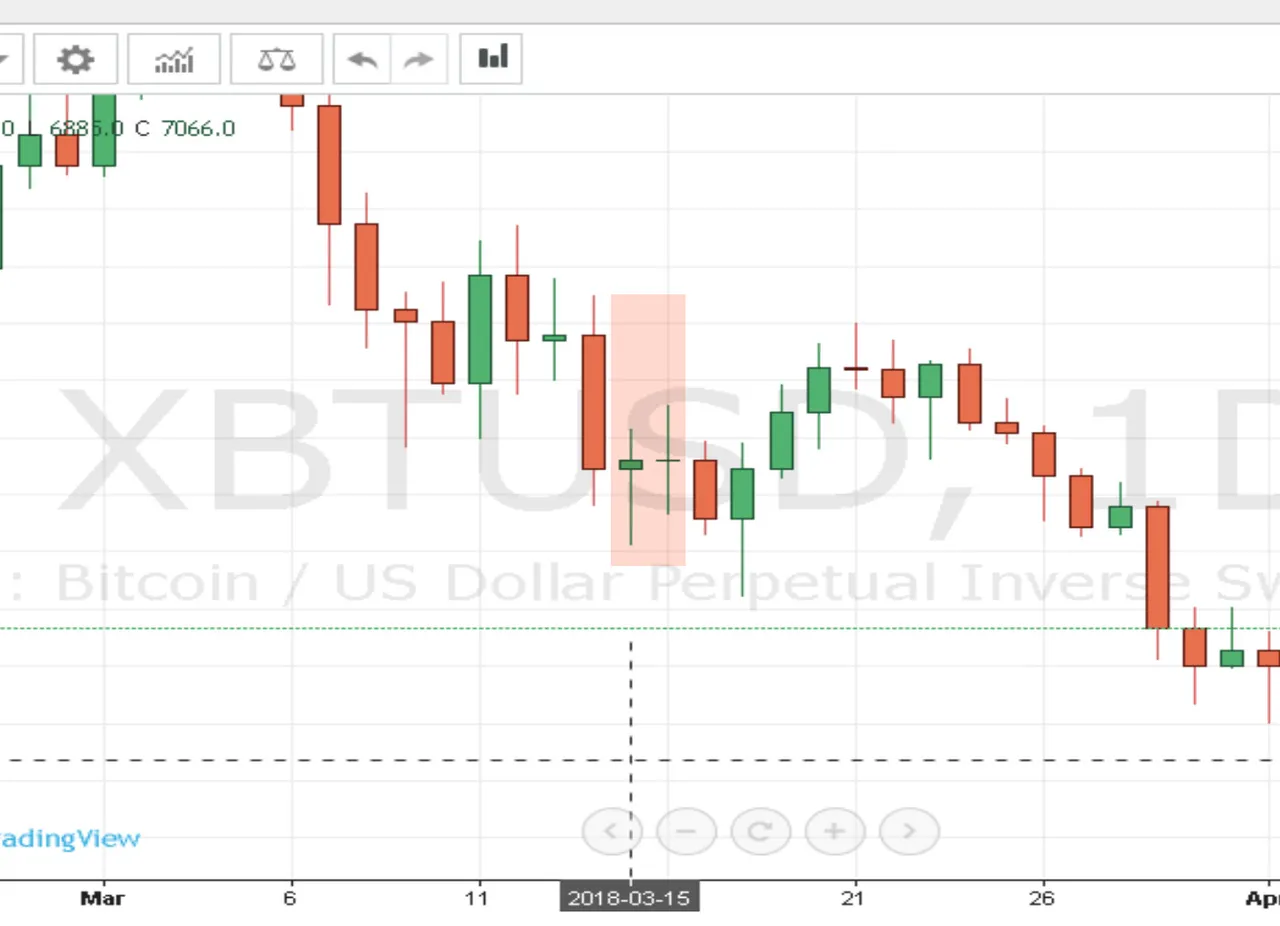
Same stock, different platform, different candles. You can see that the general values tie up, the highs and the lows, the ranges, but the individual candle patterns ?
Another example, look at the marked areas in red, on the two charts below. Do they even look remotely similar ?
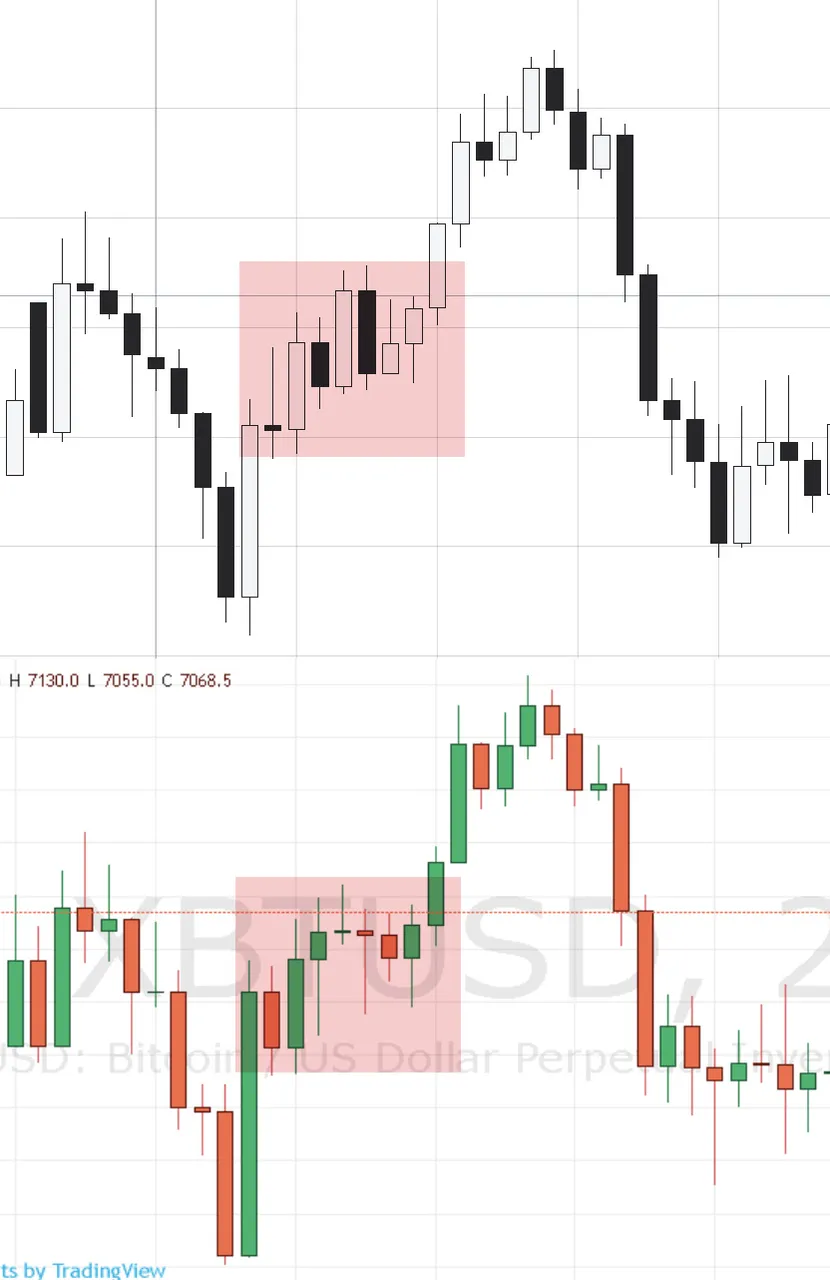
The reason for this part is to emphasise what you're looking at could be entirely different to what other people are looking at. You can be long based on your chart and they could be short, both of you with valid signals.
Doesn't that seem to indicate that it might not be a good idea to just rely entirely on candle patterns ? One of you is going to be wrong after all.
In the next candle post I'll explain more about why the open and close need to be taken in context with the time they occur.
Header image : independent.co.uk
Image found via Google image search, no affiliation
About me -
I'm a full time financial trader, mostly in Forex and Commodities. I write for fun and try to help beginner traders get started, avoiding all the mistakes that I made. I'm always happy to chat or discuss ideas so please just give me a shout in the comments !
I'm currently trying to build up SP but everything I earn from Steemit is donated to a Steemit charity or worthy user.