Repository
https://github.com/steemit/steem
Every month I produce a Post bench-marking report with the aims of:
• Aiding the Steemit Community with a place to benchmark their posts and growth
• Create a report that can be used for comparisons in other periods
• To track my personal targets and record achievements
Over the last few months I have added new data to this report, including comparisons to the same period last year, top earn authors and authors with the highest number of votes. Last month I added details of flags and this month I have added more statistical calculations to the mix, as per requests :-)
Please note this data is based on Posts and not Comments.
If you missed last month’s full report you can read it here:
https://steemit.com/utopian-io/@paulag/may-steemit-post-benchmarking-report-blockchain-business-intelligence
Financial Performance
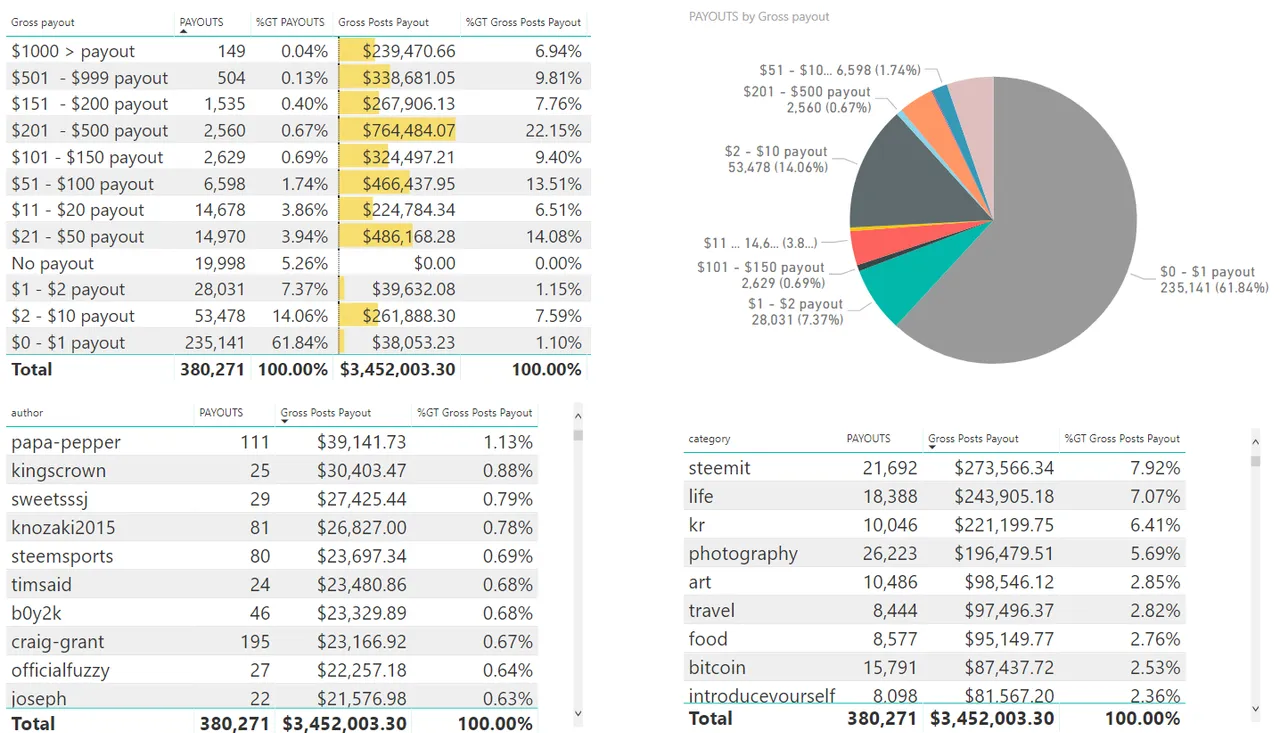
June 17 Report
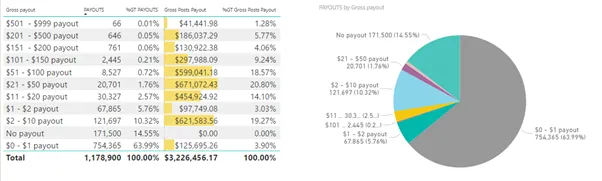
May ’18 Report
June ‘18 Report
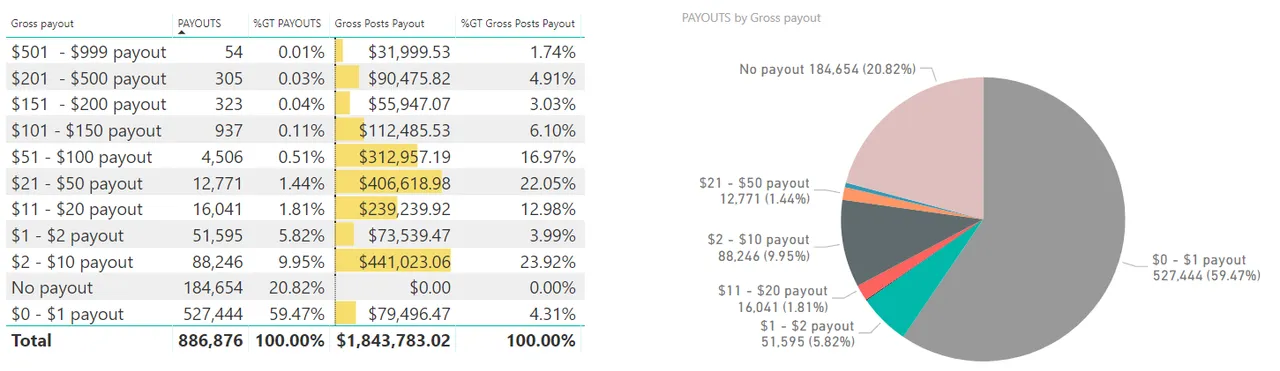
In June ’18 the % of posts with No pay-out was almost 21% up from 14.55% in May. Although in April ’17 this was 56.23%
The % of posts with a pay-out of <$1 is down to 59.47% from 63.99% in May. The number of posts that earned over $500 reduced from 66 in May to 54 in June.
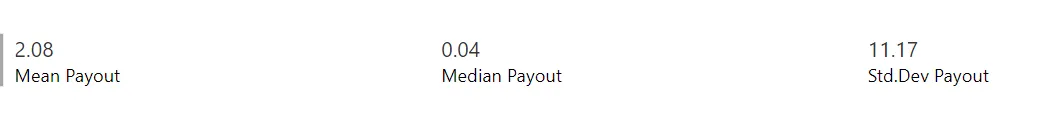
The average post pay-out value in June was $2.08, May ’18 was $2.73. In April ’18 was $3.18. In March it was $1.76 SBD, $2.56 SBD in Feb and $3.81 SBD in Jan. If we exclude posts with no pay-out the average post pay-out increases to $2.62 SBD. In JMay the average post pay-out excluding post with no pay-out was $3.20 SBD.
The median payout value was $0.04 with a standard deviation of 11.17
In June '17 these stats were
The number of posts decreased from May 18 to June 18 by 25%, and the pay-out value decreased by 43% for the same period.
However, from June’17 to June ’18 the number of posts increased by 133% and the total pay-out value was down by 46%
My Stats
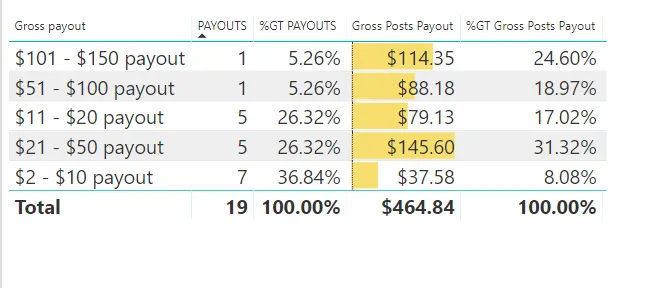
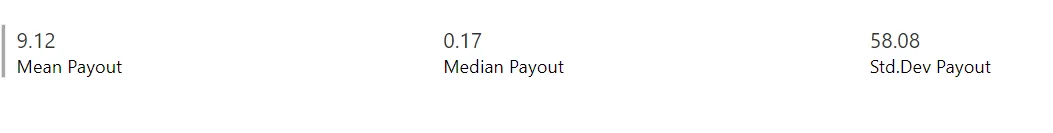
With the same number of posts in May and June, my total post pay-out is only down almost 51%. This month I had 53% of posts in the pay-out range of < $20 SBD and less than 6% of my posts earned more than $101. My posts have earned on average $24 which is considerably higher than the average post on Steemit.
Top Authors based on pay-outs
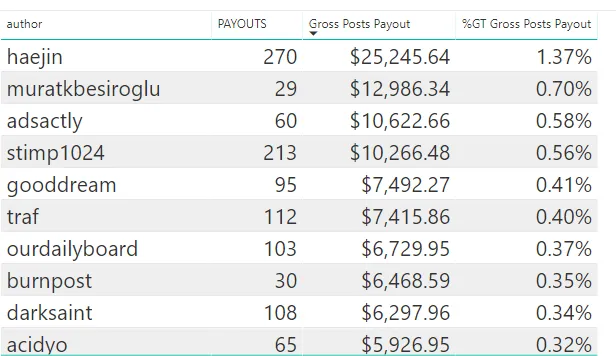
From this report we can see that many of the top earns from last month are still on the list. @burnpost is still in the top list, showing a little karma!
Top Category’s
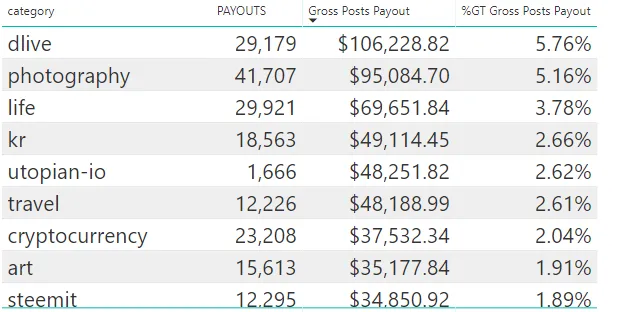
Dlive has been slowly creeping up the ladder and is now the top category.
Comments
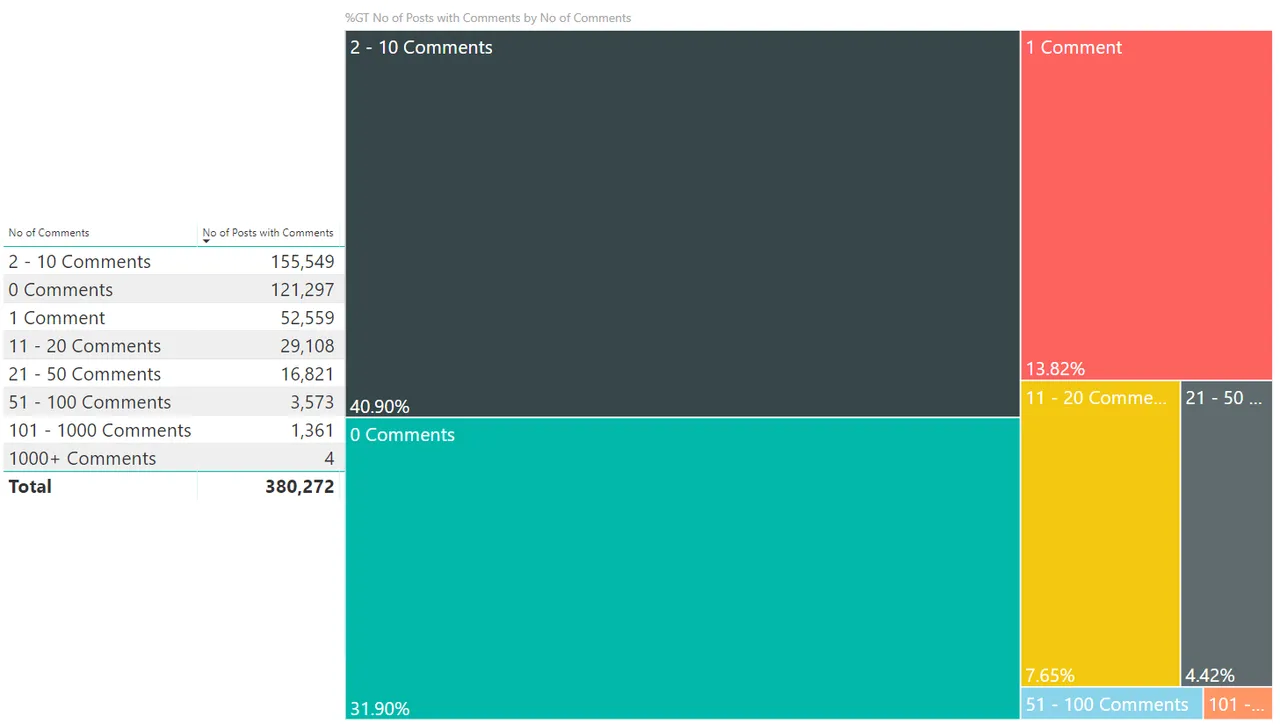
June ‘17
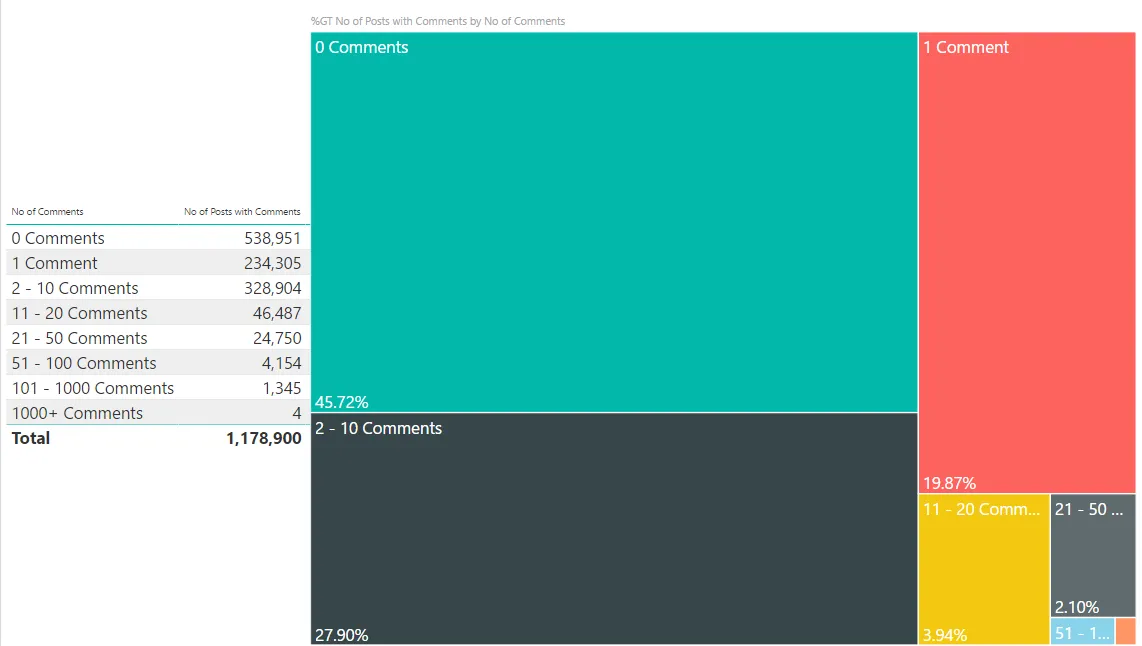
May ‘18
June '18
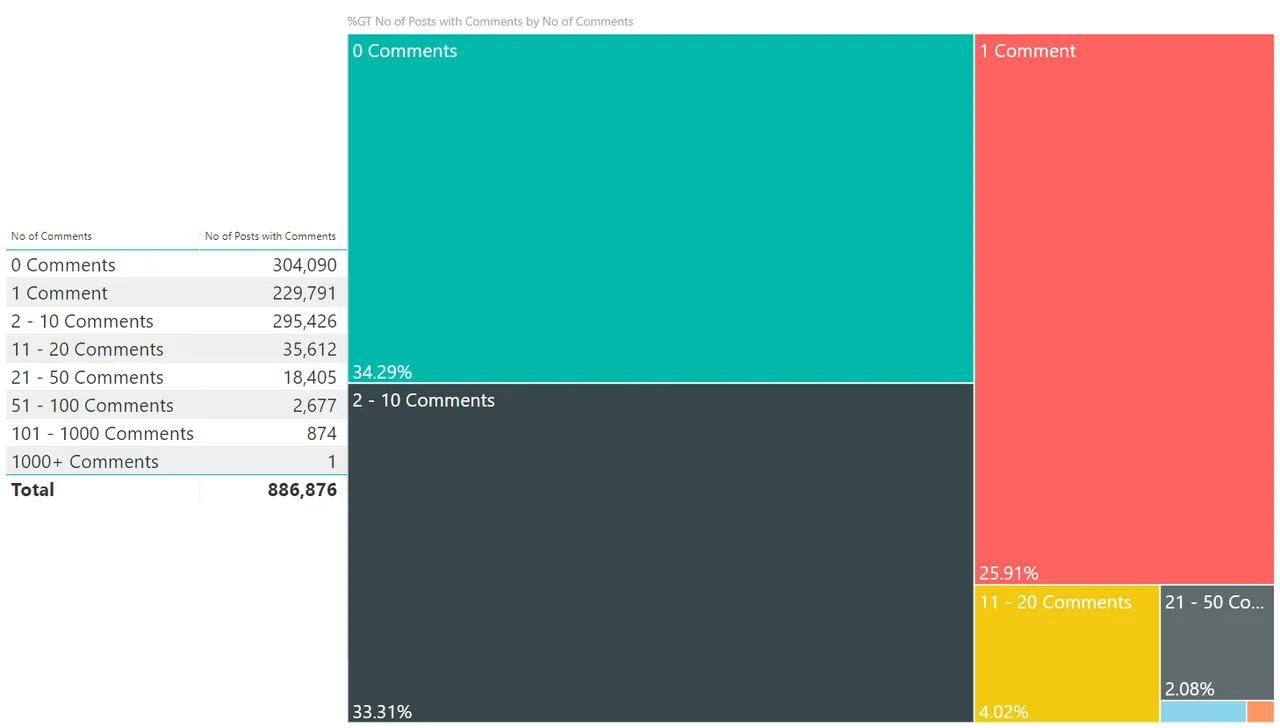
The % of posts with no comments is up down from 45.72% in May to only 34.29% in June. This is offset with the % of posts with 1 comment. This is up from almost 20% to almost 26% in June and the %of posts with 2-10 comments is also up from 27.9% to 33%.
This increase in the % of posts with comments could be down to bots or it could be down to fewer posts to engage with.
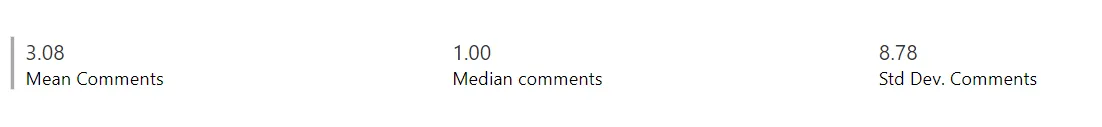
Statistical Calculations
June '18
June '17

My Stats
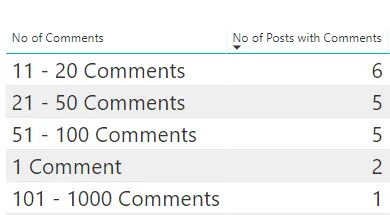
In June 31% of my post received 51+ comments.
Votes
June ‘17
May ‘18
June ‘18
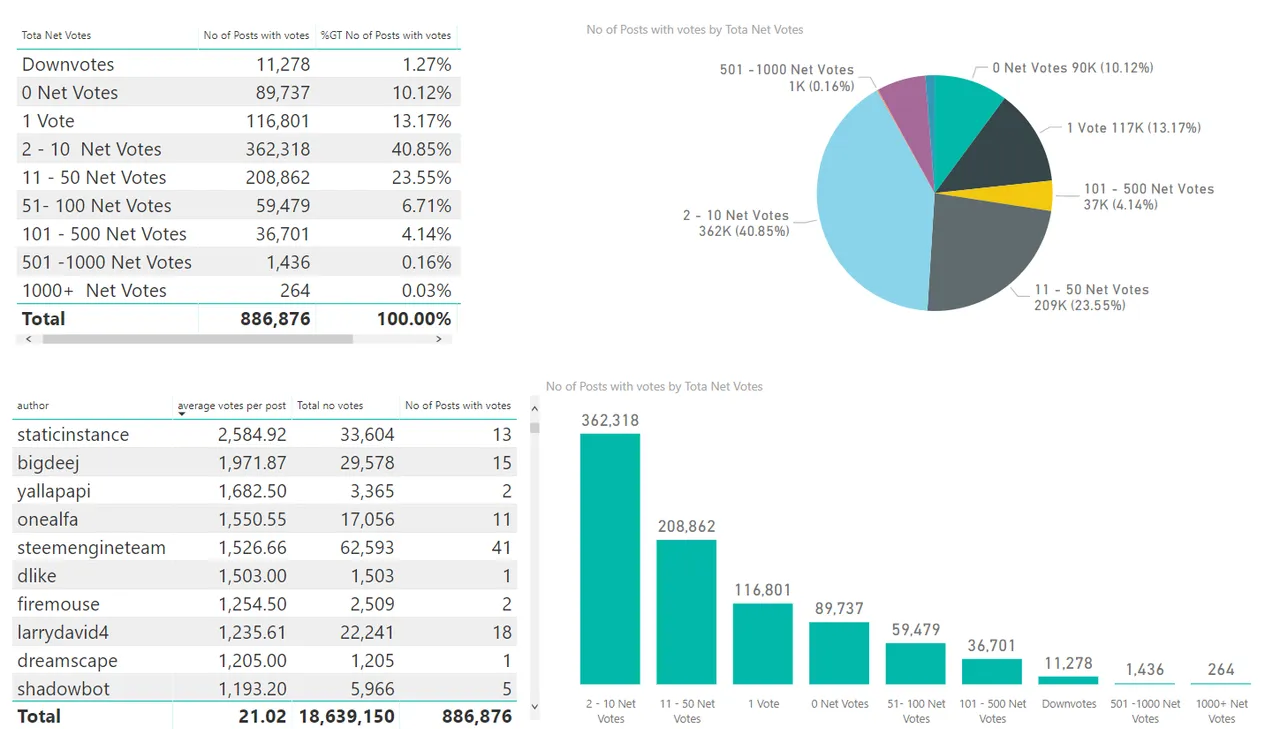
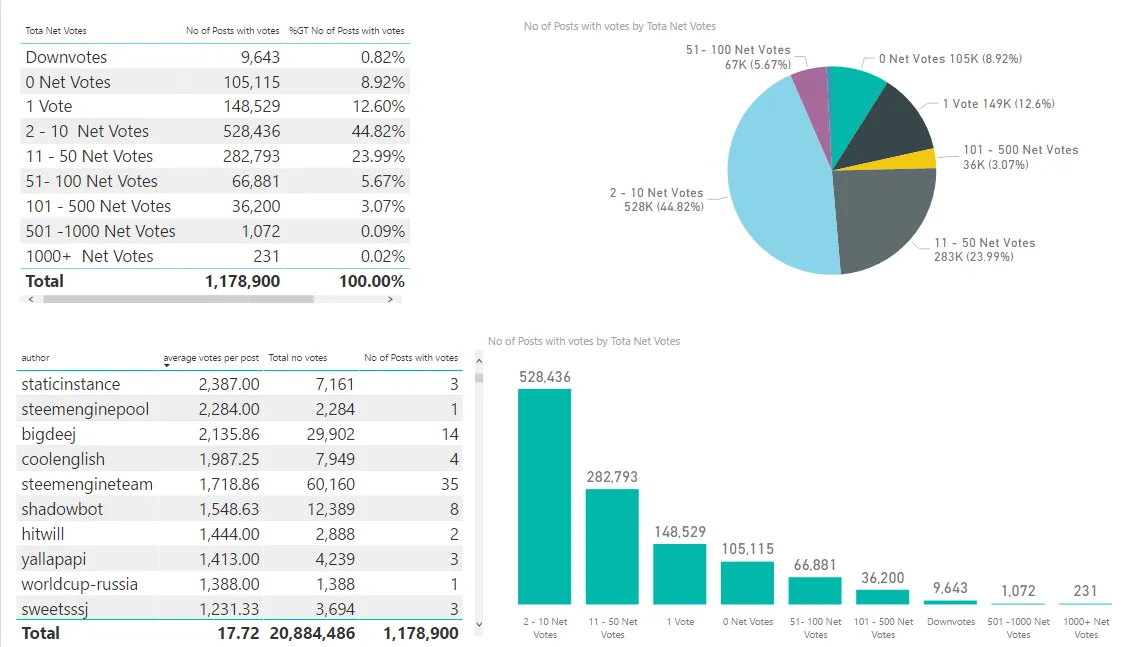
The % of posts with 0 net votes has increased from 8.9% in May to 10.2% in June.
Statistical Calculations
The average number of votes per post in June ‘18 was 21, up from 17.72 in May ‘18. The median is 5.

In June 17 these values were

Flags
In votes above we also have flags, however combined only1.27% of posts had a net downvote. This is up from 0.82% the previous month.
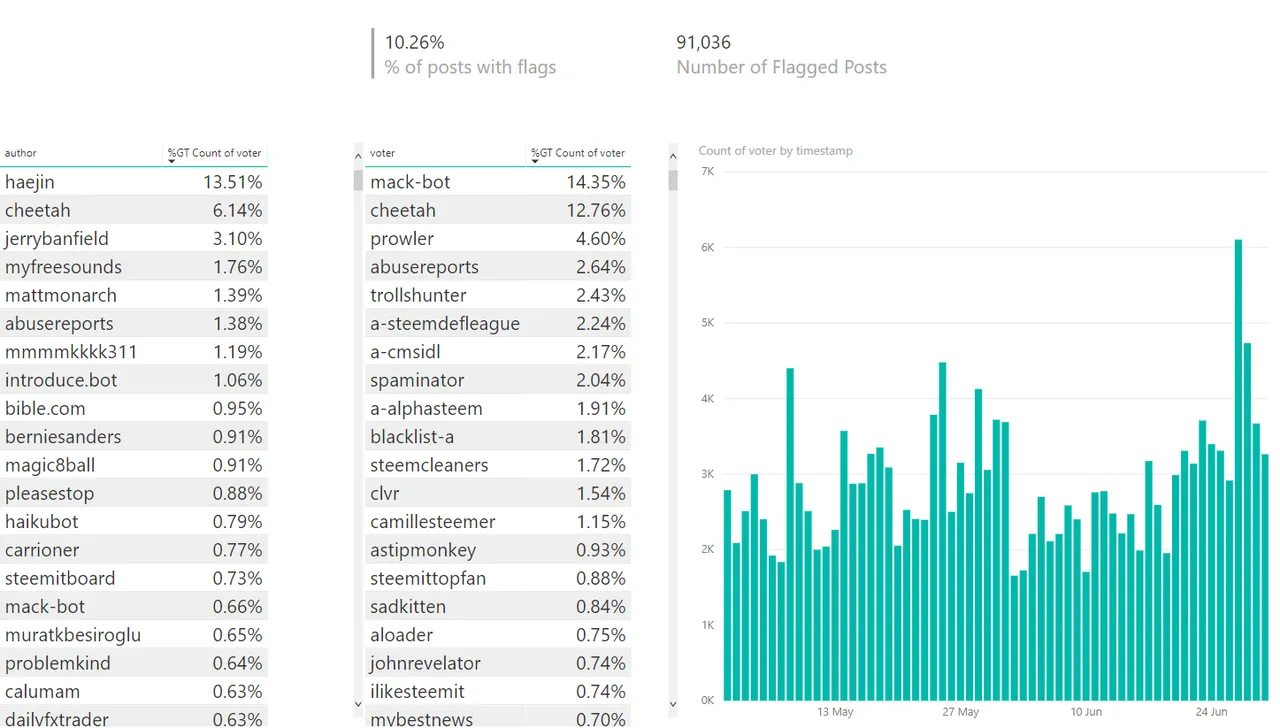
91K posts received 1 or more flags( this is posts not comments). This makes up 10.26% of all posts made. This is up from 3.97% the previous month.
In the first table we can see the authors with the highest % of flags and after this we can see the time series for when flags were given
My Stats
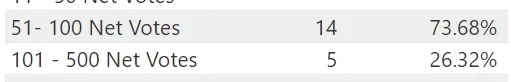
Awesome 100% of my posts received 51+ votes without the use of voting bots.
Other Data
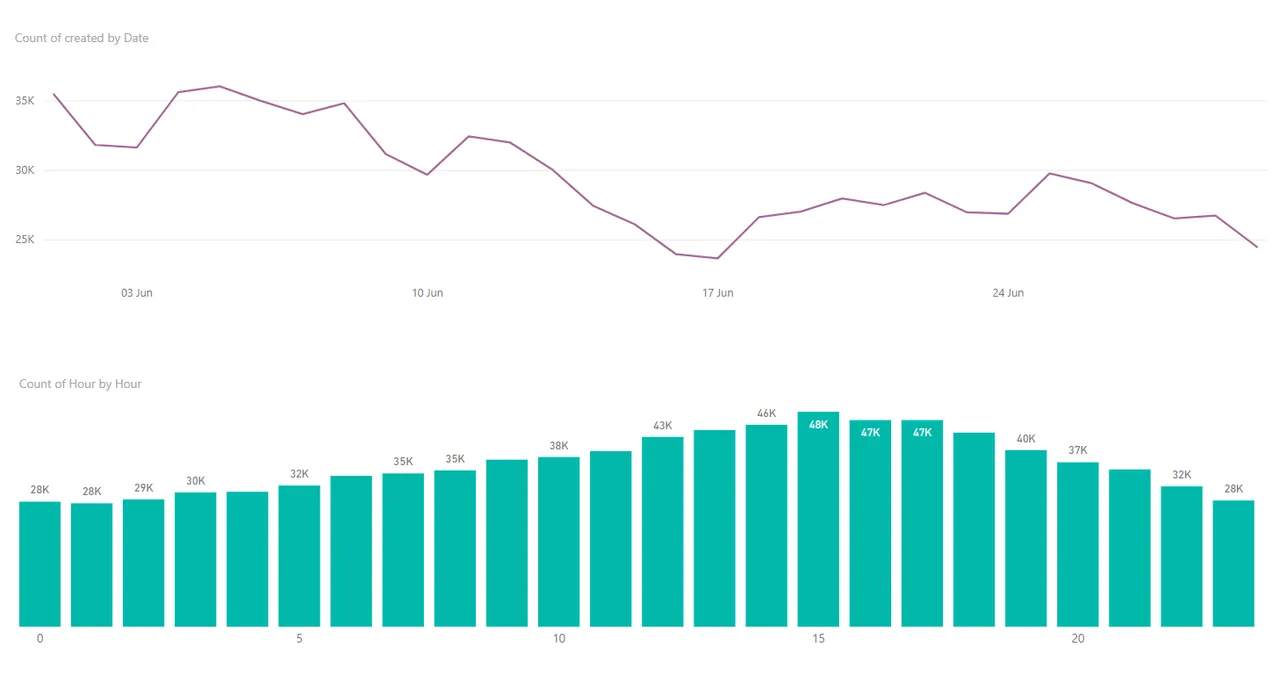
The line chart above represents the number of new posts per day in June 18 and the bar chart below that shows the peak posting hours.
Conclusion
As the price of STEEM and SBD was on a downward trend in June, this has had a direct impact in the worth of a vote and so the financial performance of posts.
The number of posts made this month was down on last month by 25%, however the payouts were down by a greater % which is disappointing to see.
With regards to my own data, I am rather disappointed in the results. However it seems from the data that a lot of stuff is down, less posts, lower payouts. It will be interesting to see how July turns out as it 'feels' to me like the platform is very quiet.
So how did your posts preform in June ’18? - Please do comment below and let me know.
The Data source and Query
As always I have connected to Steemsql managed by @arcange using Power BI and the query is used
for 2018 data was
SELECT author, category, created, children, total_payout_value, net_votes, pending_payout_value FROM Comments (NOLOCK) where created >= CONVERT(DATE,'2018-06-01') and created< CONVERT(DATE,'2018-07-01') and depth = 0And 2017 query was
SELECT author, category, created, children, total_payout_value, net_votes, pending_payout_value FROM Comments (NOLOCK) where created >= CONVERT(DATE,'2017-06-01') and created< CONVERT(DATE,'2017-07-01') and depth = 0