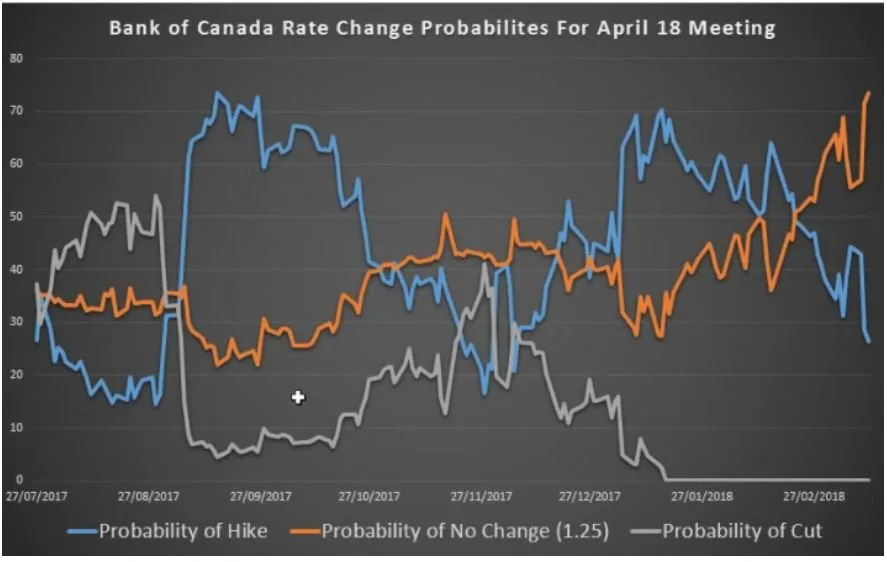
The CAD has been on the defensive lately especially after Bank of Canada chief Stephen Poloz appeared to have taken an April rate hike off the table. A key market that traders will look at to see how a rate hike is priced in is the Overnight Index Swap market, which shows different rate levels at different tenors based economic developments and central bank guidance.
A look at the falling probability of the hike can help you see how why the Canadian Dollar rate has recently weakened as the probability for a hike has fallen from ~70% to ~25% this week.
Point to Establish Short Exposure: Retracement to 83.10/50 zone
Spot: 81.75
Initial Target/Point to bring a stop to break even:79.50
Swing Target (If not holding trade :)78.42 JPY per CAD (78.6% Fib of 2016-2018 Range)
Invalidation Level: 85.30
the Jpy could see the further strengthening and the weak Canadian Dollar may be the path of least resistance for Yen gains.
The key pivot on the chart is the 61.8% at 81.25. A breakdown below this level would indicate a further wash out of CAD longs and a move into JPY longs.
The next zone to the downside is 79.42/80, which is the 78.6% retracement of the 2016-2018 and the 261.8% Fibonacci extension of the double-top from the September-January double top with a neckline in November.
The invalidation on the bearish breakdown continuing is the 38.2% retracement of the 2018 range at 85.22.
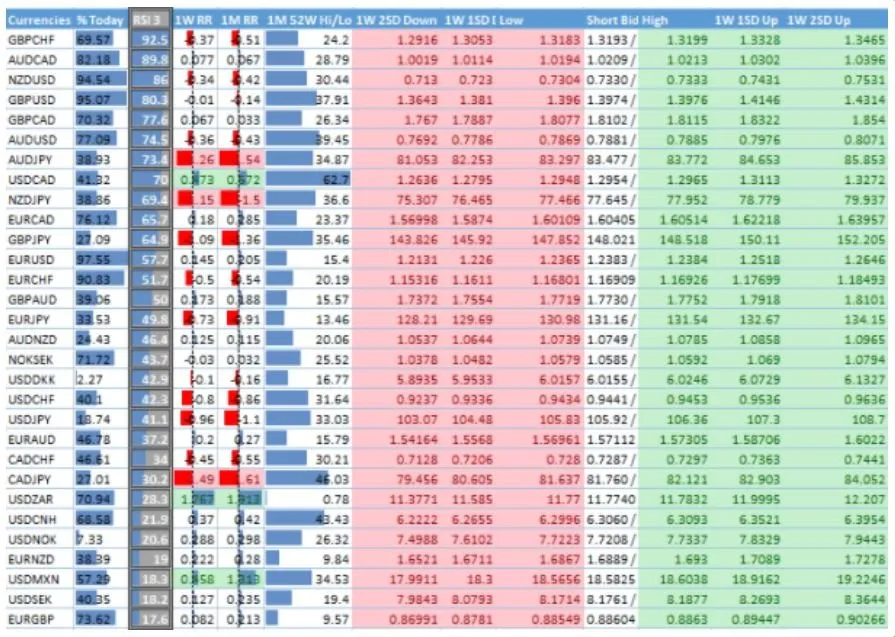
TECHNICAL DASHBOARD SHOWS PERSISTENTLY WEAK CAD
Posted on Utopian.io - Rewarding Open Source Contributors