
This tutorial is part of a series where different aspects of quickly creating and deploying STEEM web applications by using the Django framework as well as Beem are discussed. Knowledge of programming with Python is advised, as well as HTML and CSS.
Repository
https://github.com/chartjs/Chart.js
https://github.com/django/django
What will I learn
- Installing Charts.js and Django Rest Framework
- Setting up an API endpoint
- Generating charts with Charts.js
Requirements
- Python 3.7
- Django 2.1.5
- Django Rest Framework 3.9.1
- Git
- Pipenv
Difficulty
- intermediate
Tutorial
Preface
The Django framework is quite flexible and can easily be integrated with other frameworks. This allows the programmer to focus on the core functionality while other frameworks can be used for less important features.
Setup
Download the base files via Github and branch to the initial commit. Install the required packages.
$ cd ~/
$ clone https://github.com/Juless89/django-chartsjs.git
$ cd django-chartsjs
$ pipenv install django==2.1.5
$ pipenv shell
(django-chartsjs) $ pip install djangorestframework==3.9.1

(django-chartsjs) $ git fetch origin master b4605e27125712956cf7494d40a529cabd4fc520
(django-chartsjs) $ git checkout b4605e27125712956cf7494d40a529cabd4fc520
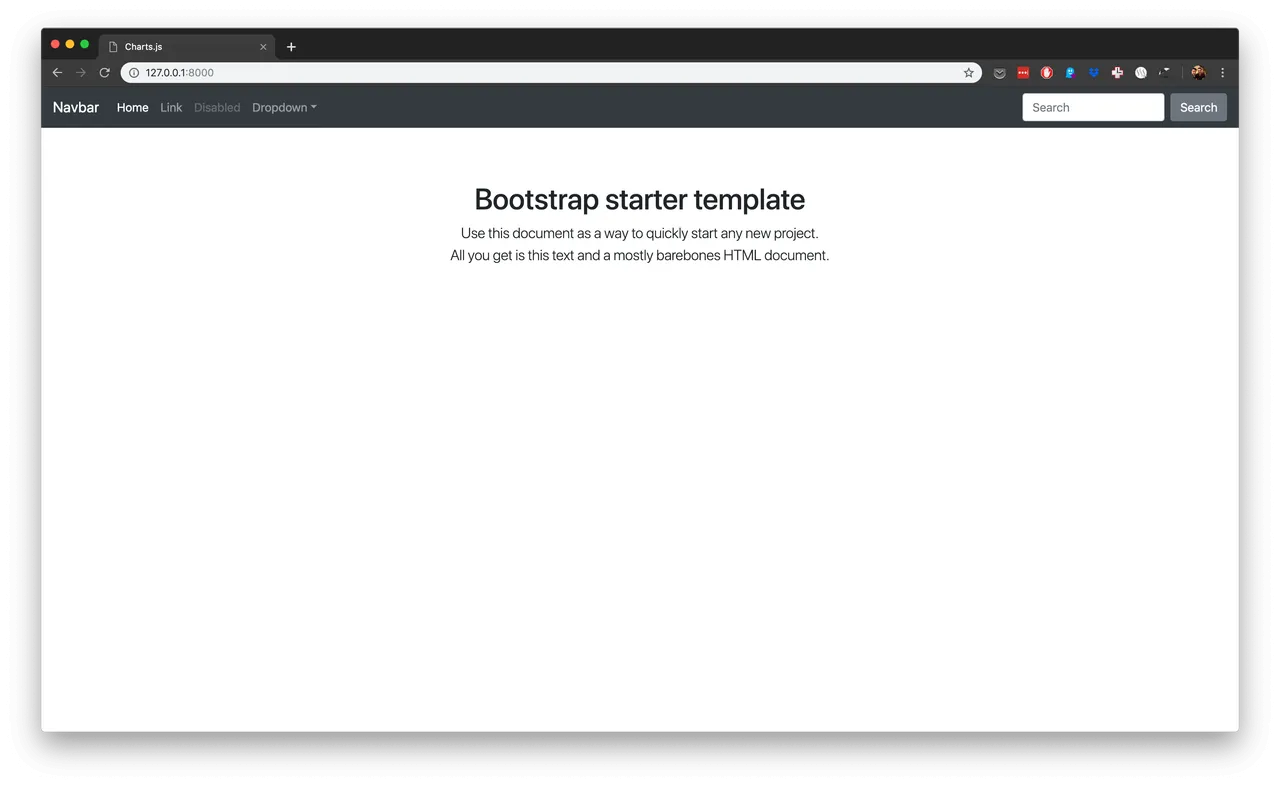
Run the server, it should look as follow:
(django-chartsjs) $ python manage.py runserver
Installing Charts.js and Django Rest Framework
The Django Rest Framework will be used to handle the api calls and needs to be added to settings.py.
# dashboard/settings.py

INSTALLED_APPS = [
    .
    .
    .
    'rest_framework',
]
Charts.js requires two changes to the base.html script packages. Replace jquery-3.3.1.slim.min.js with the full version and add Chart.bundle.js.
# templates/base.html

<script src="https://code.jquery.com/jquery-3.3.1.slim.min.js" integrity="sha384-q8i/X+965DzO0rT7abK41JStQIAqVgRVzpbzo5smXKp4YfRvH+8abtTE1Pi6jizo" crossorigin="anonymous"></script>
<script src="https://cdnjs.cloudflare.com/ajax/libs/Chart.js/2.7.3/Chart.bundle.js" integrity="sha256-o8aByMEvaNTcBsw94EfRLbBrJBI+c3mjna/j4LrfyJ8=" crossorigin="anonymous"></script>
Setting up an API endpoint
Create a new view from the class APIView. The view returns data in a JSON format that is compatible with Charts.js. For now the data is hard coded, eventually this should be generated or retrieved from a database.
# charts/view.py
from rest_framework.views import APIView
from rest_framework.response import Response
class ChartData(APIView):
authentication_classes = []
permission_classes = []
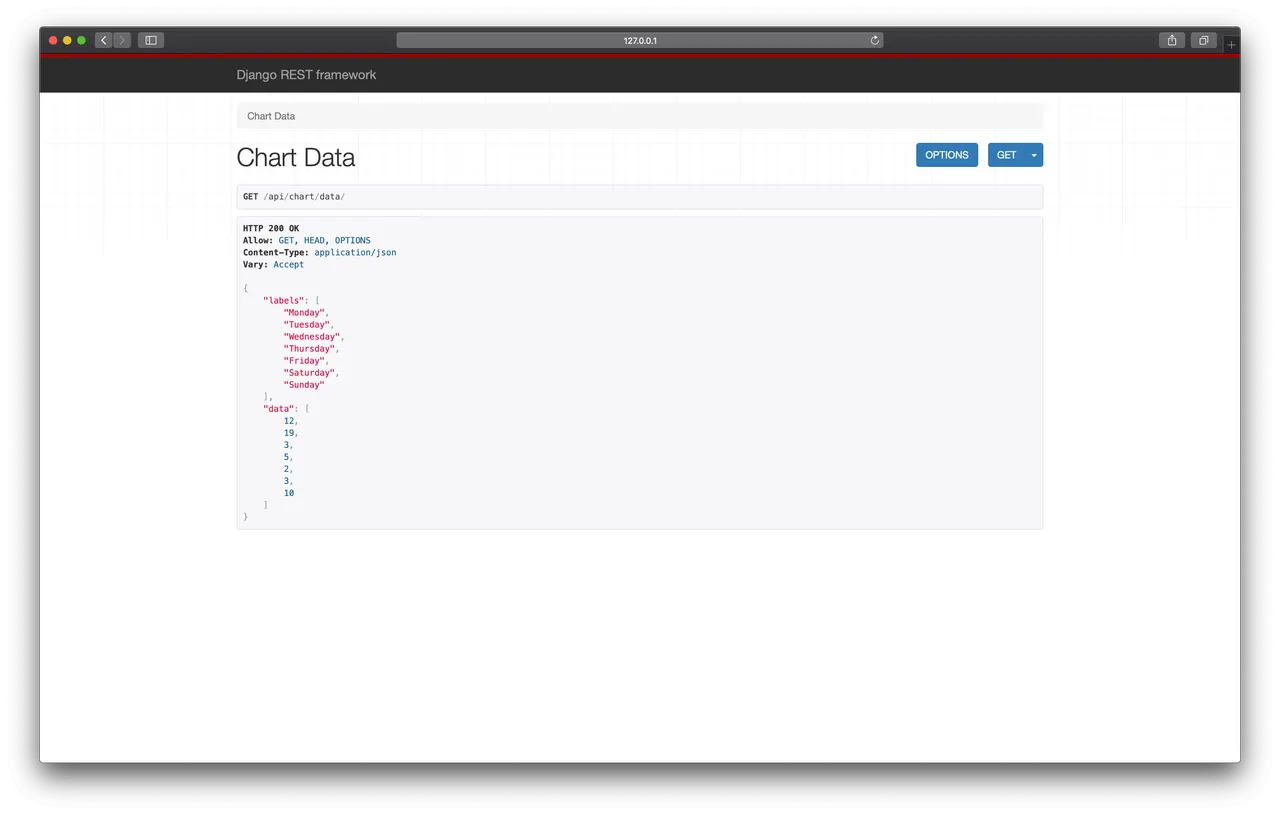
def get(self, request, format=None):
data = {
"labels": ["Monday", "Tuesday", "Wednesday", "Thursday", "Friday", "Saturday", "Sunday"],
"data": [12, 19, 3, 5, 2, 3, 10],
}
return Response(data)
Register the view to the url api/chart/data/.
# charts/urls.py

from .views import HomePageView, ChartData

urlpatterns = [
    path('', HomePageView.as_view(), name='home'),
    path('api/chart/data/', ChartData.as_view()),  # new
]
Validate if the api is working correctly. http://127.0.0.1:8000/api/chart/data/
Generating charts with Charts.js
Add the following container to index.html underneath <div class="starter-template">. The javascript makes sure the entire block is loaded before the code is run. The html centers the chart and fixes it's size.
# templates/index.html

<div class="container">
    <div class="row">
        <div class="col-sm-3"></div>
        <div class="col-sm-6">
        <canvas id="myChart" width="400" height="400">
            <script>
                $(document).ready(function(){
                {% block jquery %}{% endblock %}
                })
            </script>
        </canvas>
        </div>
        <div class="col-sm-3"></div>
    </div>
</div>
Charts.js has examples on their website. Which can easily be adjusted.
<script>
var ctx = document.getElementById("myChart").getContext('2d');
var myChart = new Chart(ctx, {
    type: 'bar',
    data: {
        labels: ["Red", "Blue", "Yellow", "Green", "Purple", "Orange"],
        datasets: [{
            label: '# of Votes',
            data: [12, 19, 3, 5, 2, 3],
            backgroundColor: [
                'rgba(255, 99, 132, 0.2)',
                'rgba(54, 162, 235, 0.2)',
                'rgba(255, 206, 86, 0.2)',
                'rgba(75, 192, 192, 0.2)',
                'rgba(153, 102, 255, 0.2)',
                'rgba(255, 159, 64, 0.2)'
            ],
            borderColor: [
                'rgba(255,99,132,1)',
                'rgba(54, 162, 235, 1)',
                'rgba(255, 206, 86, 1)',
                'rgba(75, 192, 192, 1)',
                'rgba(153, 102, 255, 1)',
                'rgba(255, 159, 64, 1)'
            ],
            borderWidth: 1
        }]
    },
    options: {
        scales: {
            yAxes: [{
                ticks: {
                    beginAtZero:true
                }
            }]
        }
    }
});
</script>
Create a new file charts.html that extends index.html to separate the code for the chart. Put everything outside the <script> tags between: {% block jquery %}....{% endblock %}. Ajax is used to GET the chart data from the api-endpoint and catching any errors.
(django-chartsjs) $ touch templates/charts.html
# templates/charts.html
{% extends 'index.html' %}

<script>
  {% block jquery %}
  var endpoint = '/api/chart/data'

  $.ajax({
      method: "GET",
      url: endpoint,
      success: function(data){
        <code for the chart>
      },
      error: function(error_data){
        console.log(error_data)
      }
  })

  {% endblock %}
</script>
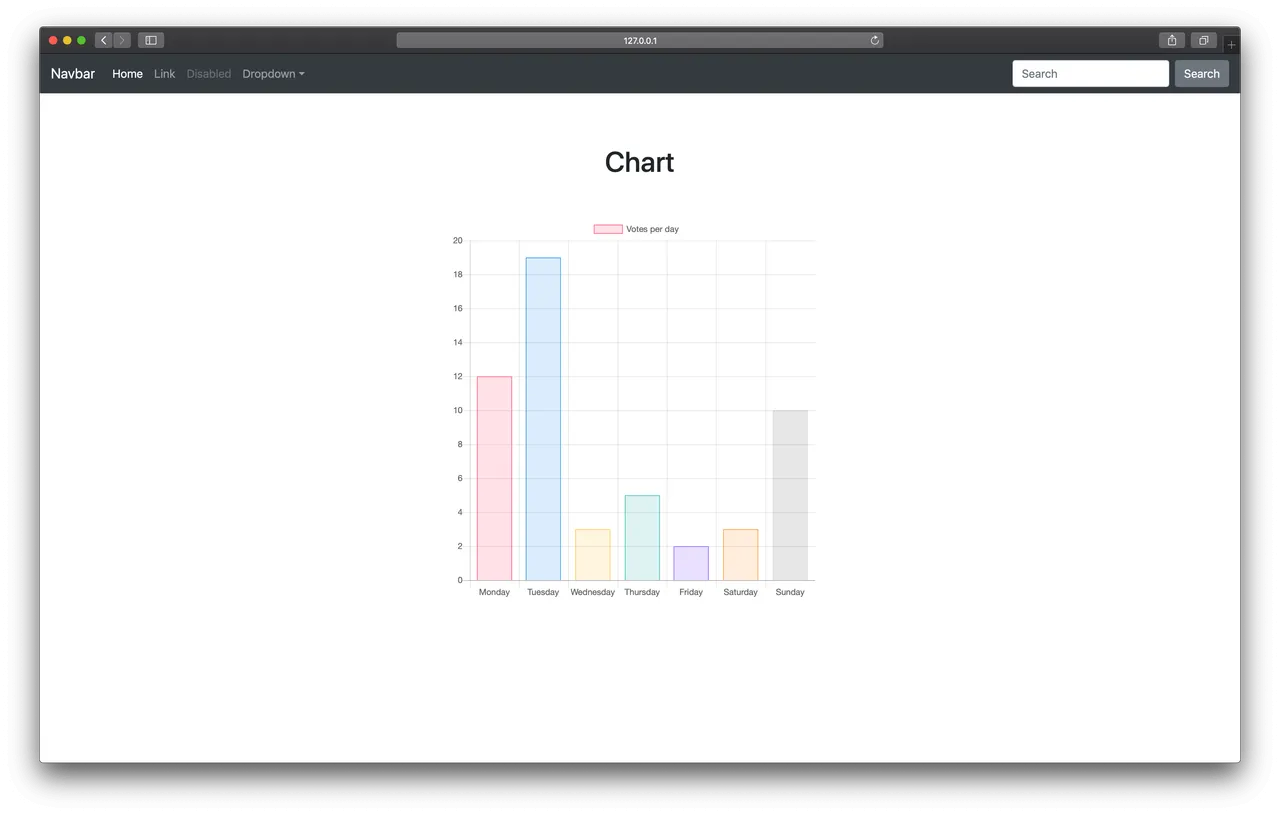
Lastly replace labels with data.labels and data with data.data inside the example code from Charts.js. And set the HomePageView to charts.html.
# templates/charts.html

data: {
  labels: data.labels, #updated
  datasets: [{
      label: 'Votes per day',
      data: data.data, #updated
# charts/views.py

class HomePageView(View):
    def get(self, request, *args, **kwargs):
        return render(request, 'charts.html')
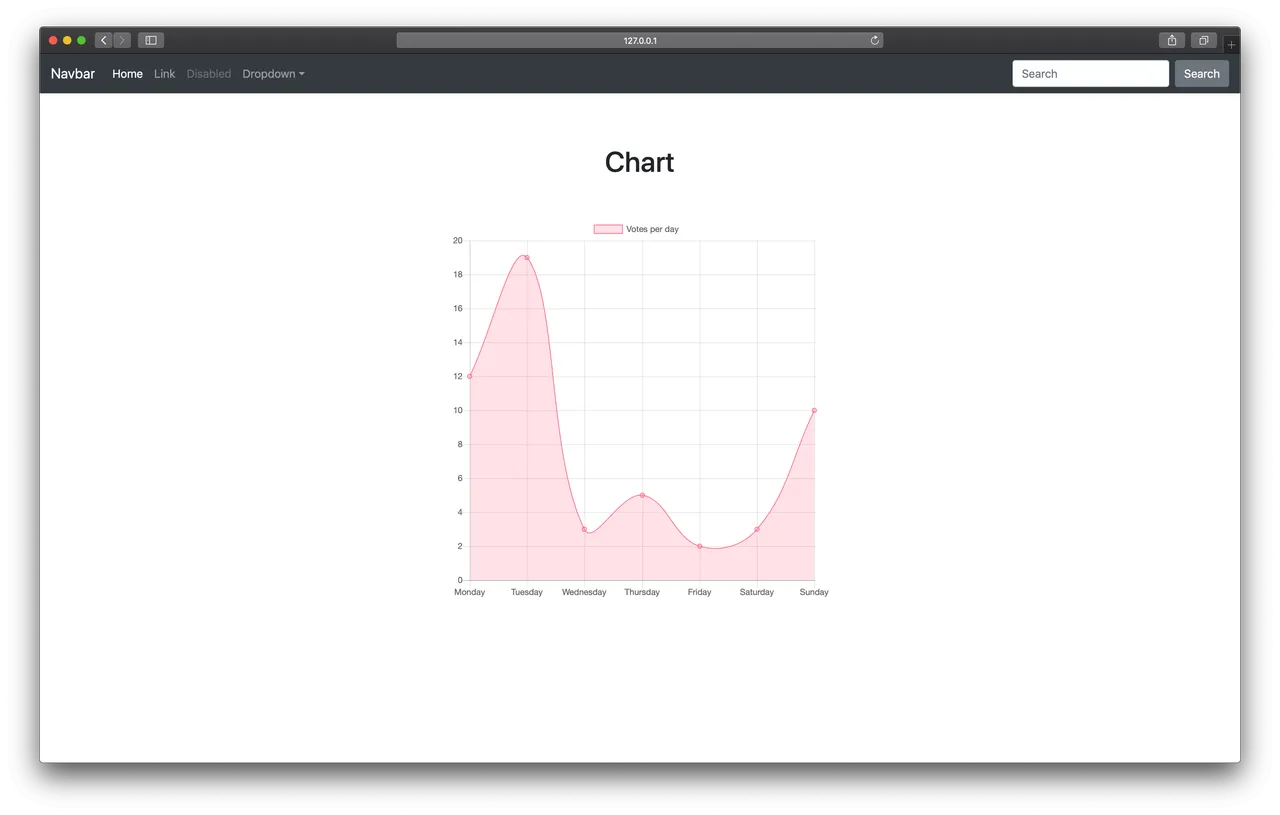
Changing the type of chart is as easy as changing type, for example to line. Check the website from Charts.js for an overview of all possible charts.
Curriculum
- Part 0: Create STEEM web applications with Django and Steem-Python
- Part 1: Using the URL to dynamically pull data via the Steem API and parse to html
- Part 2: Using A Bootstrap Template To Parse STEEM Posts Via Beem API
The code for this tutorial can be found on Github!
This tutorial was written by @juliank.