I was looking at the payout of Lyra2REv2 mining from Nicehash (green line). This is the algorithm for Vertcoin.
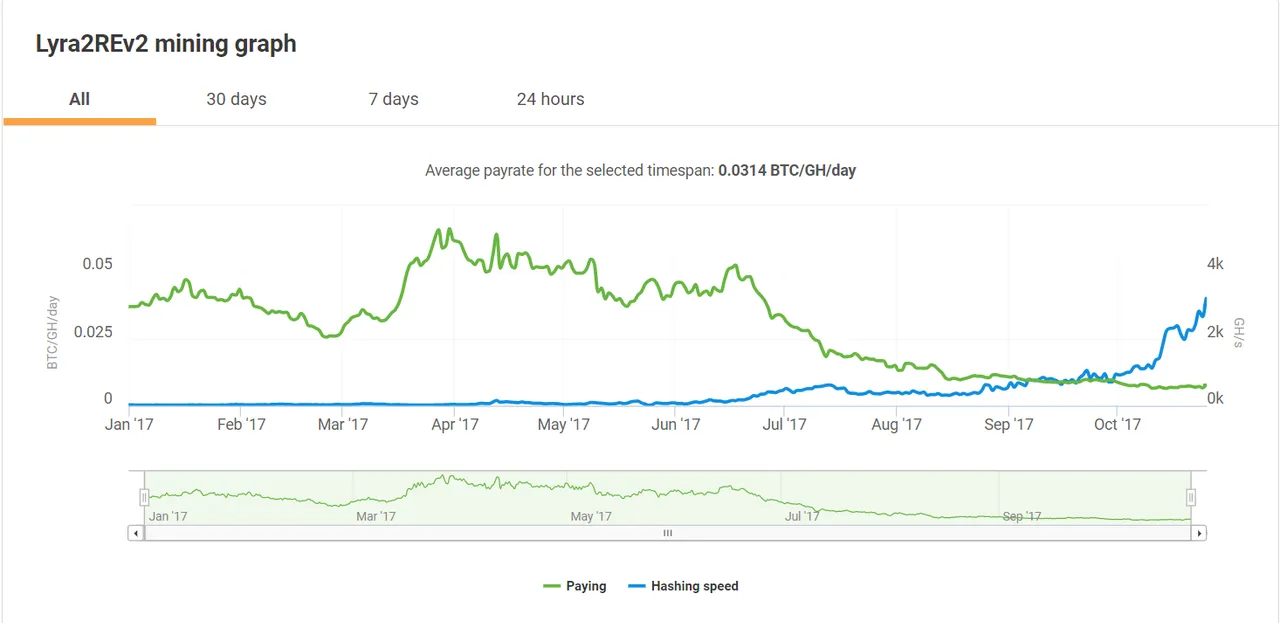
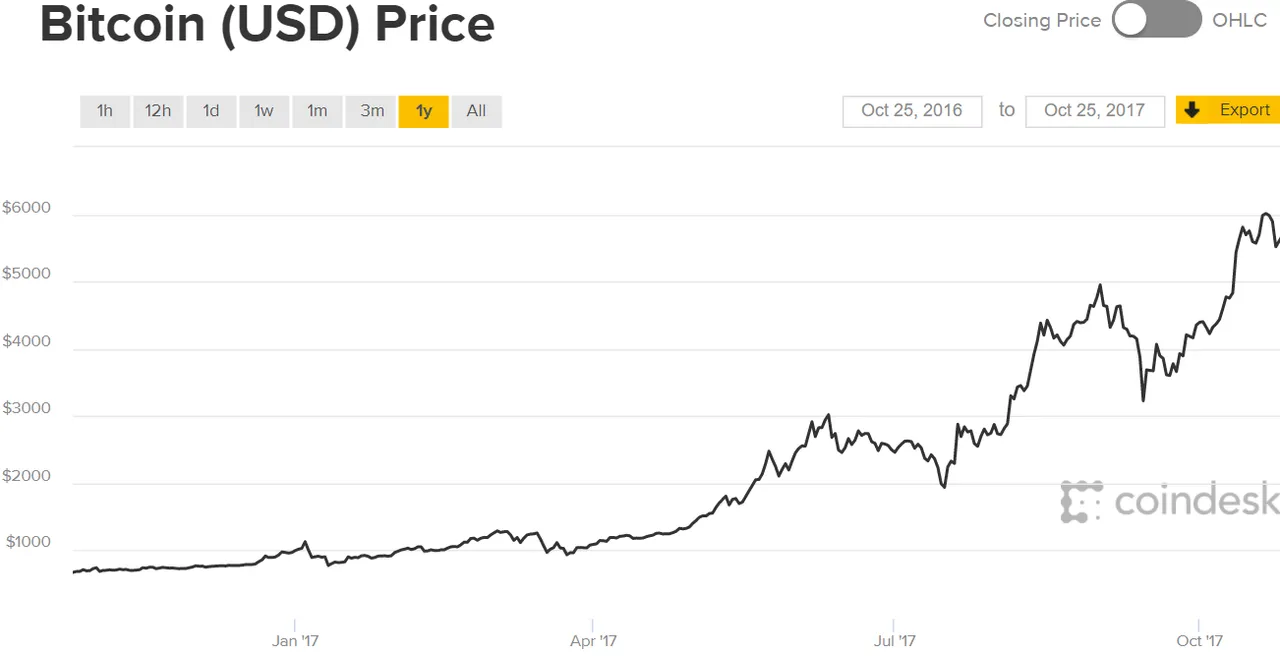
I want to use the graph to see how much payout changes over time. But the payout is in BTC which makes it hard to compare to hardware cost in USD. So I extracted the data and combine with the BTC/USD exchange rate from coindesk
This gives me the USD reward of mining 1 GH/second for 1 day. To put this figure in perspective, a GTX 1060 can mine 20 MH/second (so 1/50 of 1 GH)
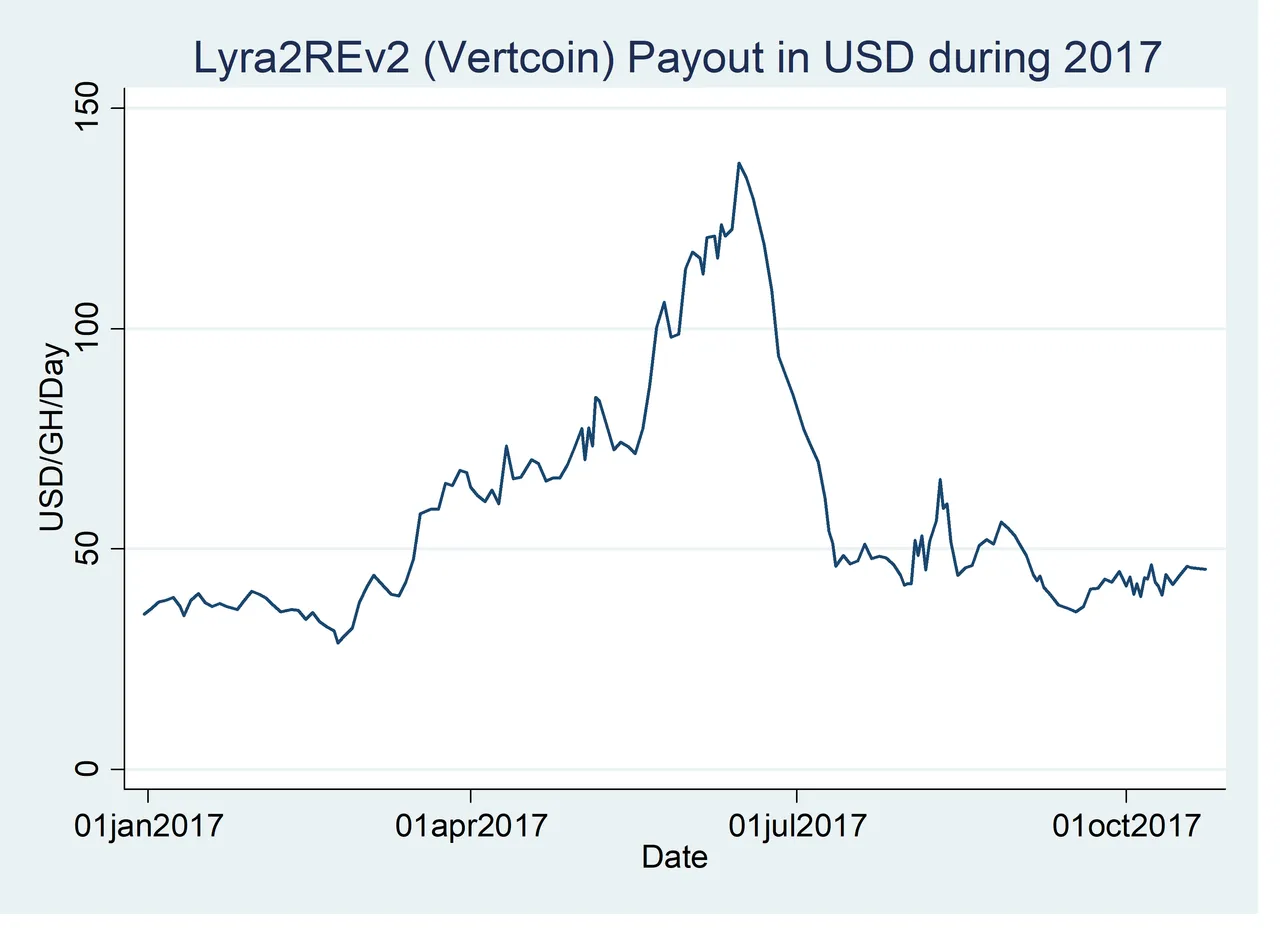
So we need to ignore the summer spike because supply has not caught up with demand. But by now GPU price has fallen, and we should be back in equilibrium. However, mining (with the same rig) is still more profitable now than at the beginning of the year. This is surprising to me, as I always thought that GPU only has a lifespan of 2-3 years. Perhaps this year is an exception.
Next, I can also figure out the total miners' payout for Vertcoin by combining with total Vertcoin hash rate from bitinfocharts
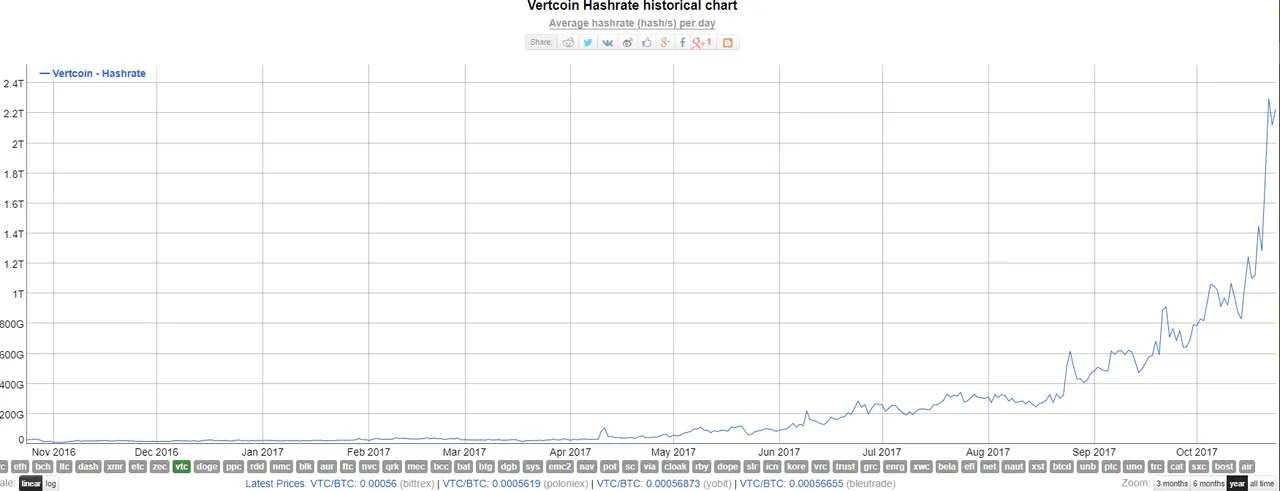
Note that this hash rate is different from blue line from nicehash graph because that blue line only counts mining through nicehash.
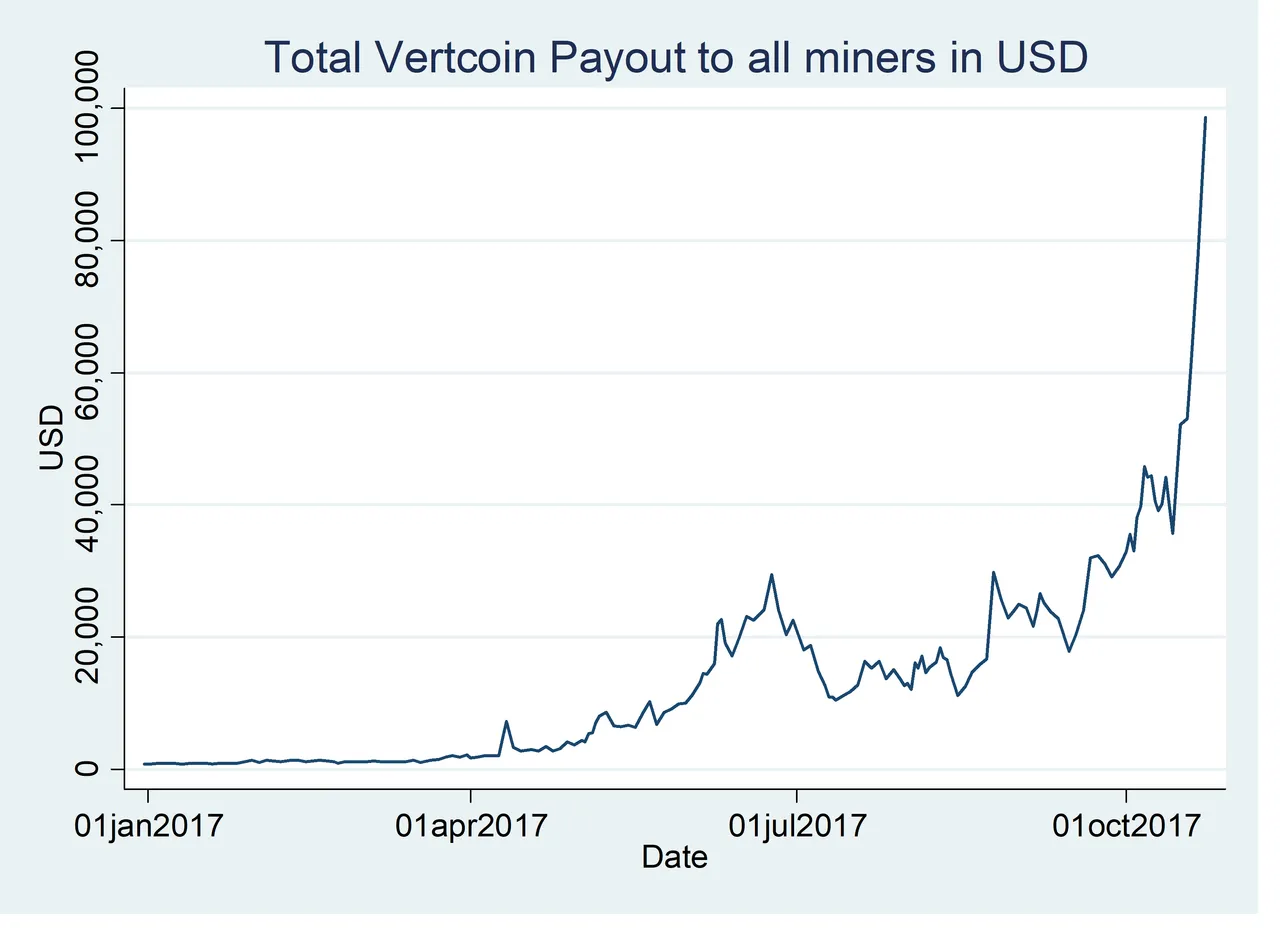
The total hashrate is skyrocketing, but the mining reward in USD is not decreasing, so total miners payout also increases! I have not looked at the difficulty graph; one can assume that it is increasing, but this is counteracted by the increase in vertcoin price.