
SUMMARY
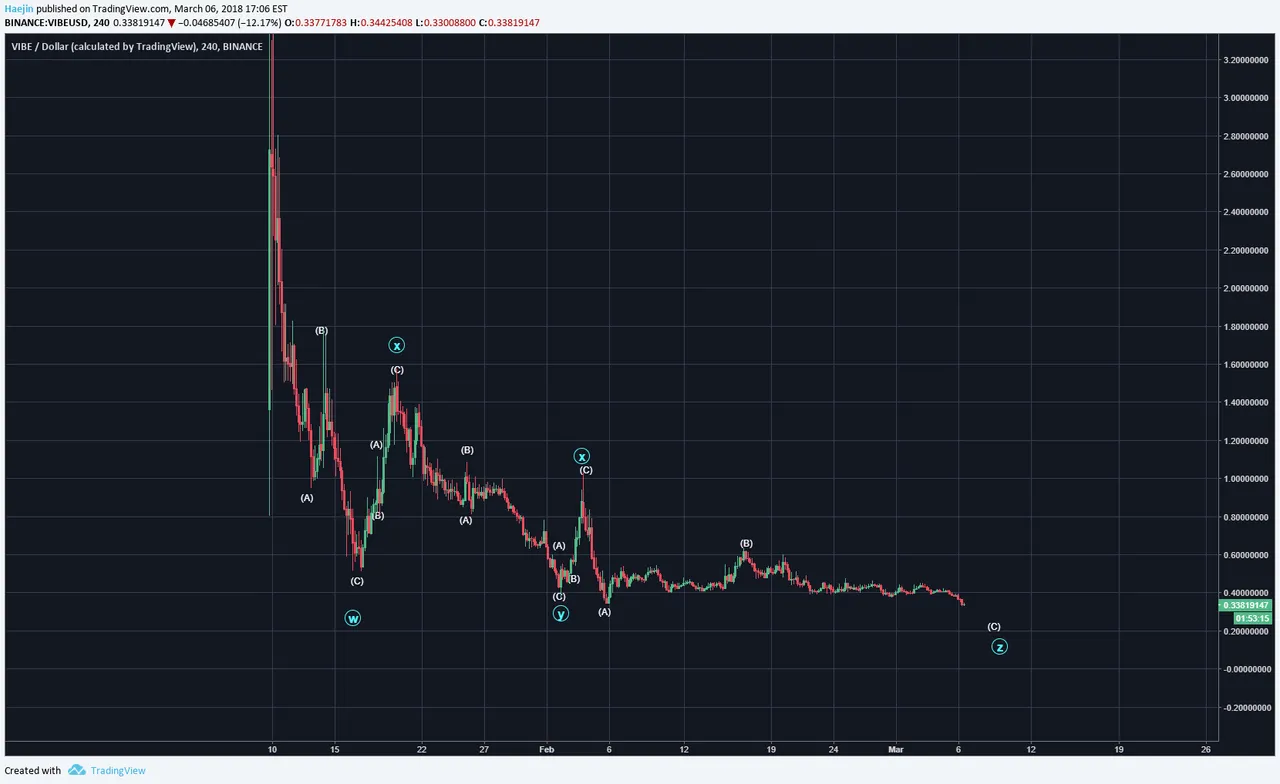
VIBE (VIBE/USD) has been in a correction phase since early February and for most of March so far, price has be going sideways, going almost nowhere. This is how an Altcoin that has not enought liquidity moves and corrects. This is the exact type of slowness an Altcoin carves out because without liquidity (widely held, many exchanges, high volume, etc); corrections just can't be accelerated.
The below chart shows a work in progress for a WXYXZ triple combination. When price goes sideways, it's almost always a double three or a triple. IF NONE of these terminology makes sense, please or if you're completely new to Technical Analysis, please consider reviewing the tutorial videos found at the end of this blog. Once the Z wave of the WXYXZ completes, it could signal the final bottom of the very long and boring correction.
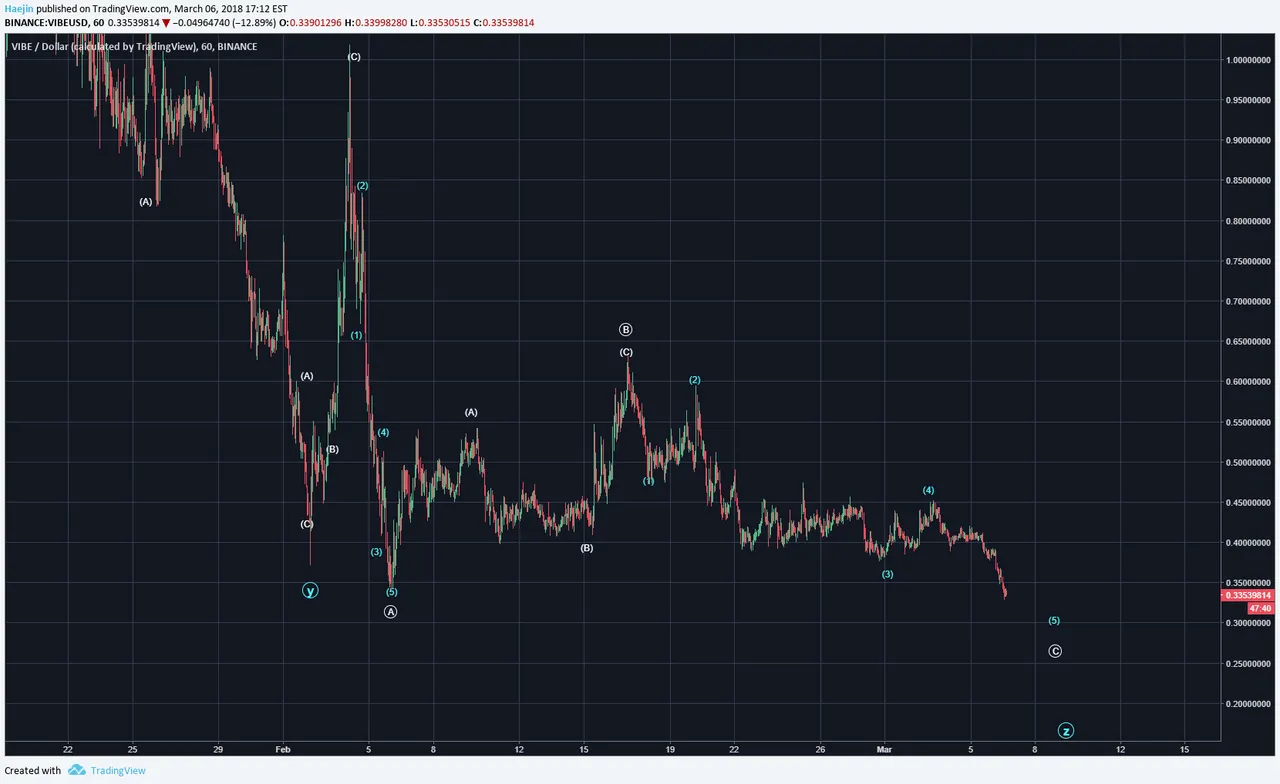
In cutting deeper into the chart at shorter time lengths, the subwaves can be discerned and labeled. Focusing on only the terminal end, the blue Z wave consists of white abc and the final c wave is subdivided by five blue miniscule waves. Bottom line: Terminal end of correction is likely at hand. When is the best time to cast a buy ladder? Terminal end of corrections.
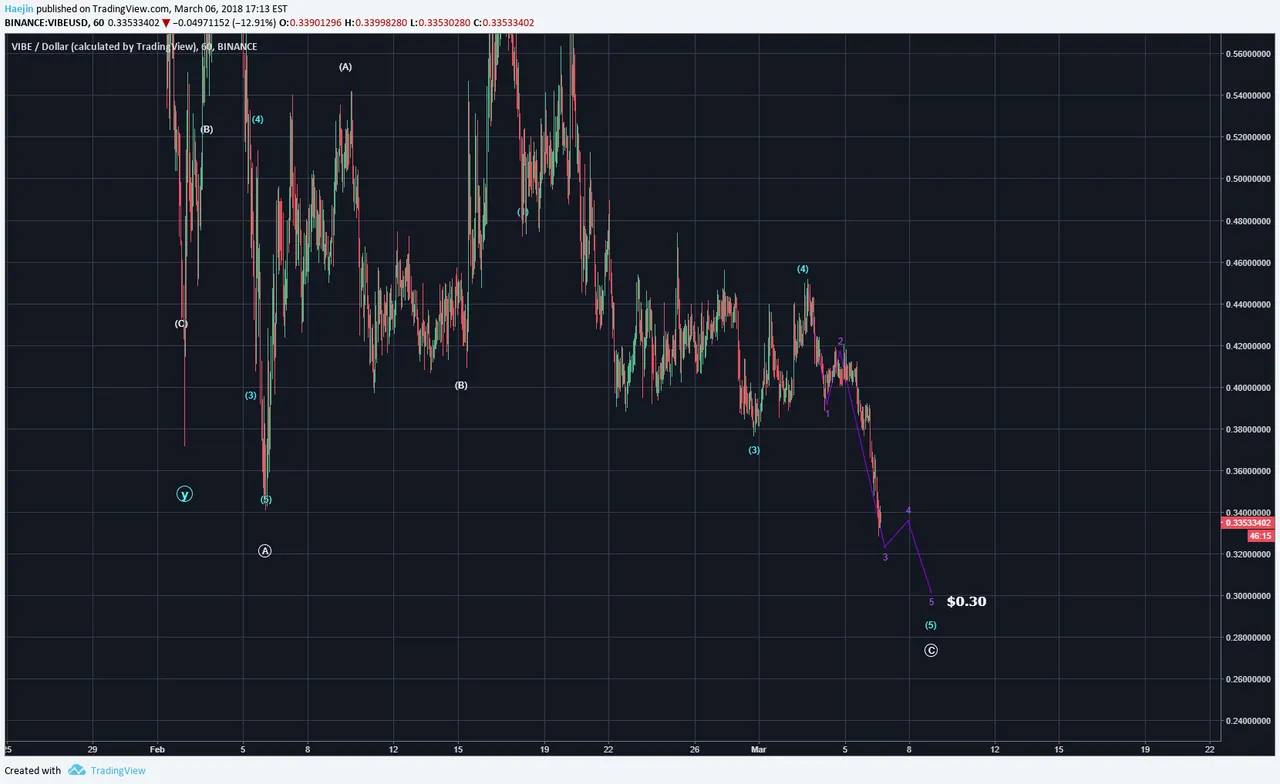
Here is even finer closeup. Why? Subwaves provide the "geo" positioning of current wave progression. The purple waves draw out the trajectory of a proposed final subwaves of blue 5 of white c of Z. The potential target for the bottom could be $0.30.
Legal Disclaimer: I am not a financial advisor nor is any content in this article presented as financial advice. The information provided in this blog post and any other posts that I make and any accompanying material is for informational purposes only. It should not be considered financial or investment advice of any kind. One should consult with a financial or investment professional to determine what may be best for your individual needs. Plain English: This is only my opinion, make of it what you wish. What does this mean? It means it's not advice nor recommendation to either buy or sell anything! It's only meant for use as informative or entertainment purposes.
Please consider reviewing these Tutorials on:
Elliott Wave Counting Tutorial #1
Elliott Wave Counting Tutorial #2
Elliott Wave Counting Tutorial #3
Laddering and Buy/Sell Setups.
Laddering Example with EOS
Tutorial on the use of Fibonacci & Elliott Waves
@haejin's Trading Nuggets
Essay: Is Technical Analysis a Quantum Event?
Follow me on Twitter for Real Time Alerts!!
Follow me on StockTwits for UpDates!!
--
--

