R programming is great for doing different types of statistical analysis but mainly for doing data visualization.
In this guide, datatreemap will show you how to make a scatterplot of labels starting from a dataset.
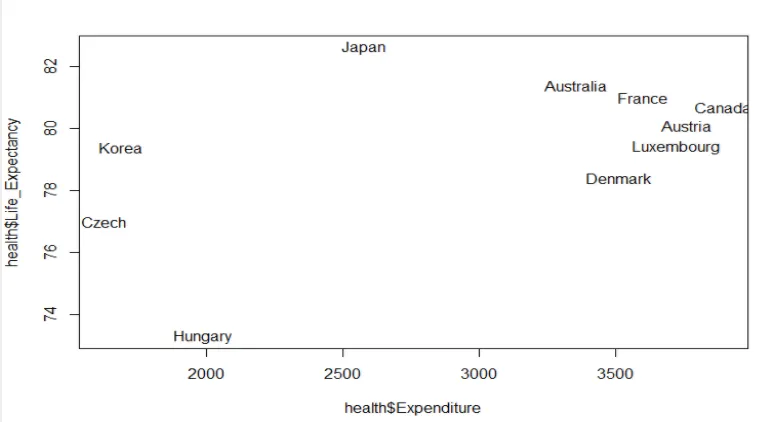
Scatter plots are useful for visualizing the relationships between an independent variable x and a dependent one y. For example, if you have a dataset in which is related a country's health expenditure as the independent variable and life expectancy as the dependent variable, by visualizing this relationship it is possible to understand how each country is doing. So if it is doing good means that the expenditure goes to improve the life of persons. If it is doing bad then too much money is spent for just a little improvement.
In this example we visualize the countries as labes and not as just simple dots
So given the dataset in which is given for every row the amount of expenditure and the life expectancy :
"Country","Expenditure","Life_Expectancy","Doctor_Visits"

"Australia",3357,81.4,6.3

"Austria",3763,80.1,6.7

"Canada",3895,80.7,5.8

"Czech",1626,77,12.6

"Denmark",3512,78.4,7.5

"France",3601,81,6.3

"Hungary",1988,73.3,10.8

"Japan",2581,82.6,13.6

"Korea",1688,79.4,11.8

"Luxembourg",3723,79.4,6.1
it is possible to visualize it following these steps that are
a) loading the data
b) visualizing it
In this example, we use R library RColorBrewer so install and use it before attempting to run the following R code
// plot the labes as text instead of dots This will render the following graphics: As you can see one of the most efficient countries when comes to improve life expectancy without spending too much is Japan. If you liked this guide please consider supporting datatreemap by upvoting or following us...and stay tuned as more guides on data visualization are coming.
// load data
health = read.csv("HealthExpenditure.csv",header=TRUE)
plot(health$Expenditure,health$Life_Expectancy,type="n")
text(health$Expenditure,health$Life_Expectancy,health$Country)