Hello Steemers!

Doing a chart for Waves today!
Pretty new coin, ranked 16th on coinmarketcap, some decent volume and volatility on trading.
The CEO Sashahad an interview on @coininterview which drew my attention:

Fore more info about WAVES check out their website and their Bitcointalk thred:
Website - https://wavesplatform.com/
BCT thread forum - https://bitcointalk.org/index.php?topic=1387944.0
Starting of with the clean charts, weekly and daily chart.
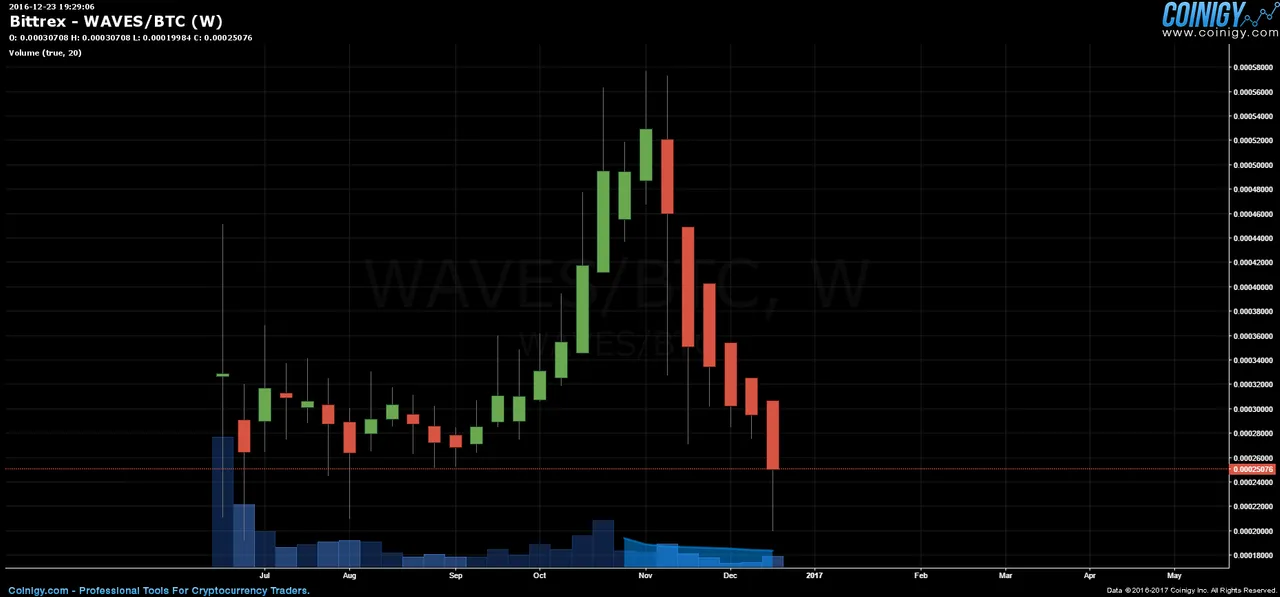
weekly chart Bittrex -clean - Dec. 23, 2016
On the weekly we can see some basic movement from about 25k to 32k satoshi in the first 3 months, followed by a hard pump to about 58k satoshi after which a hard dump started in which we still seem to be.
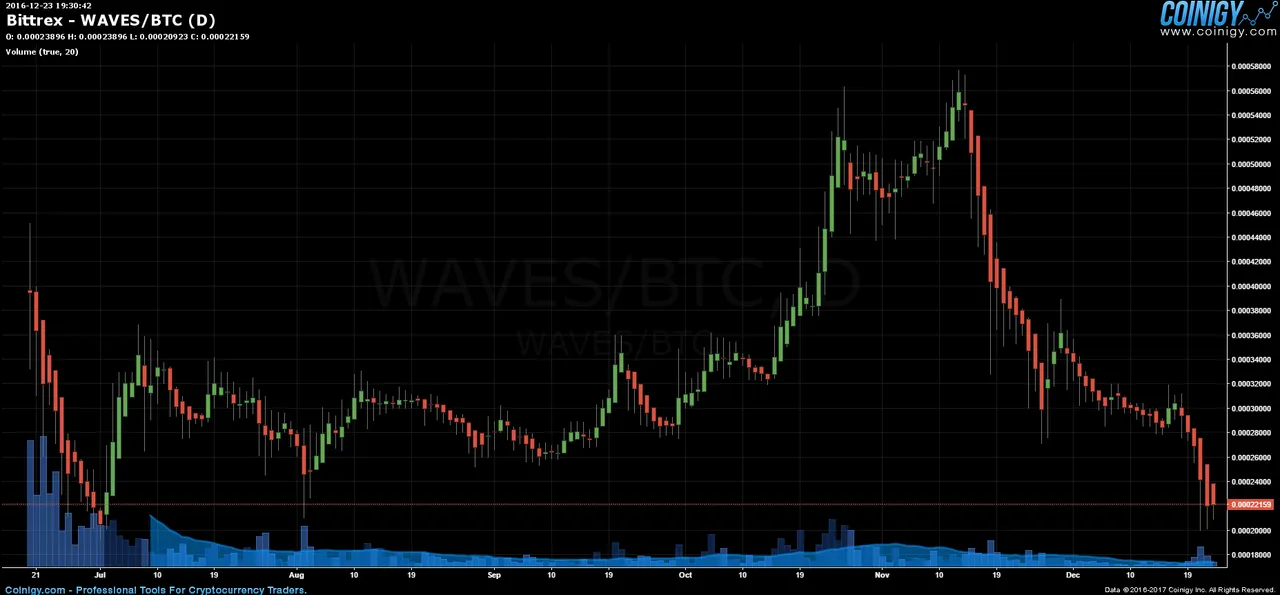
daily chart Bittrex -clean - Dec. 23, 2016
Once it's zoomed into the daily the moves are easier to see.
Putting some lines one, will focus on the daily as it gives a better overview of the moves on the market made so far.
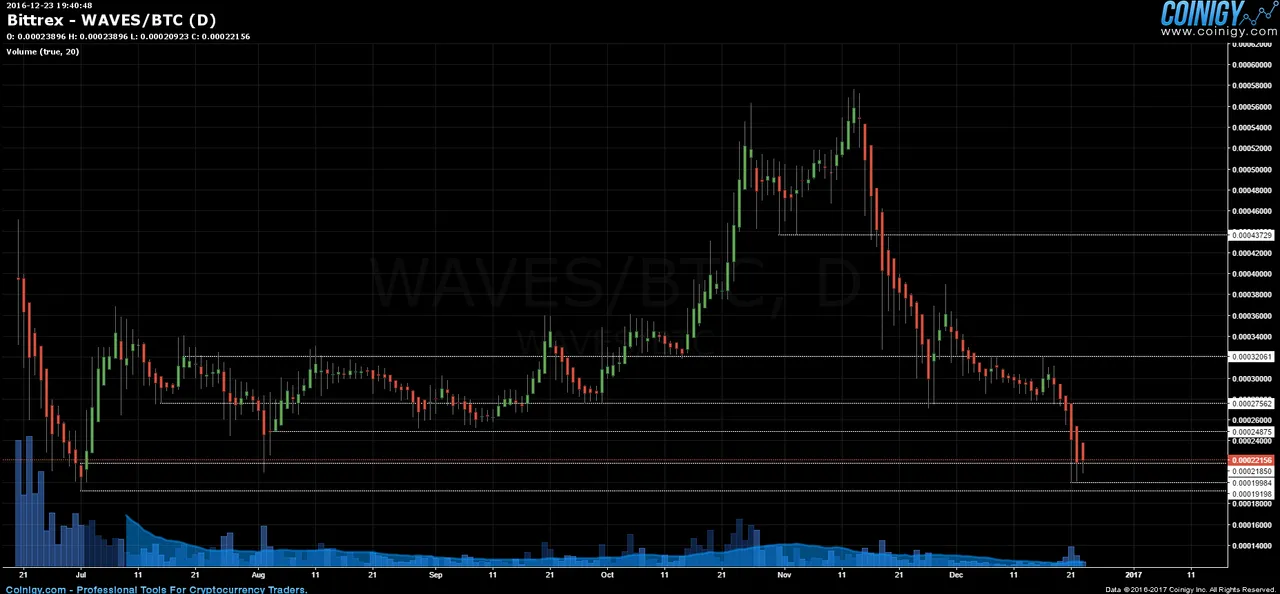
daily chart Bittrex -lines 1 - Dec. 23, 2016
With the lines on i can see some possible accumulation zones and support resistance territories, for a clearer view i painted those lines, purple and blue, each space in between the same color marking a zone.
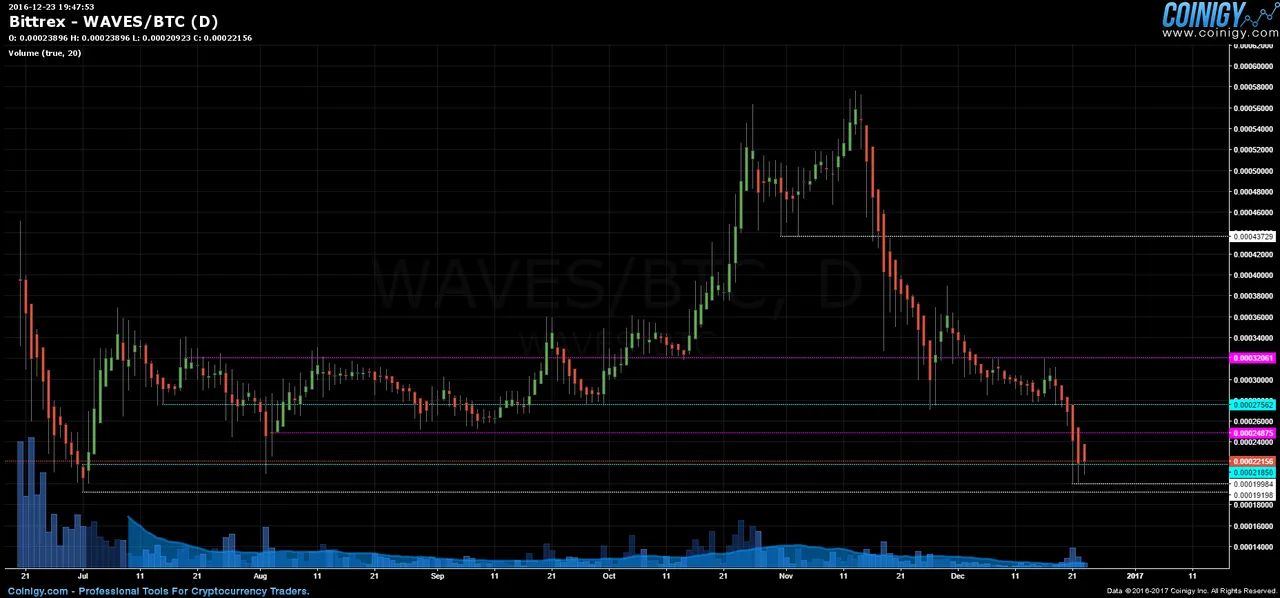
daily chart Bittrex -lines 2 - Dec. 23, 2016
After giving color to the lines we can see how before the pump there was a major accumulation zone between ~25k and 32k satoshi.
Another possible accumulation level seems to be from the ~22k to 27.5k satoshi, the 27.5k has played a major role as a support and the price has recently dumped below it finding support around the 22k saotshi line.
For the final touch putting the fib on.
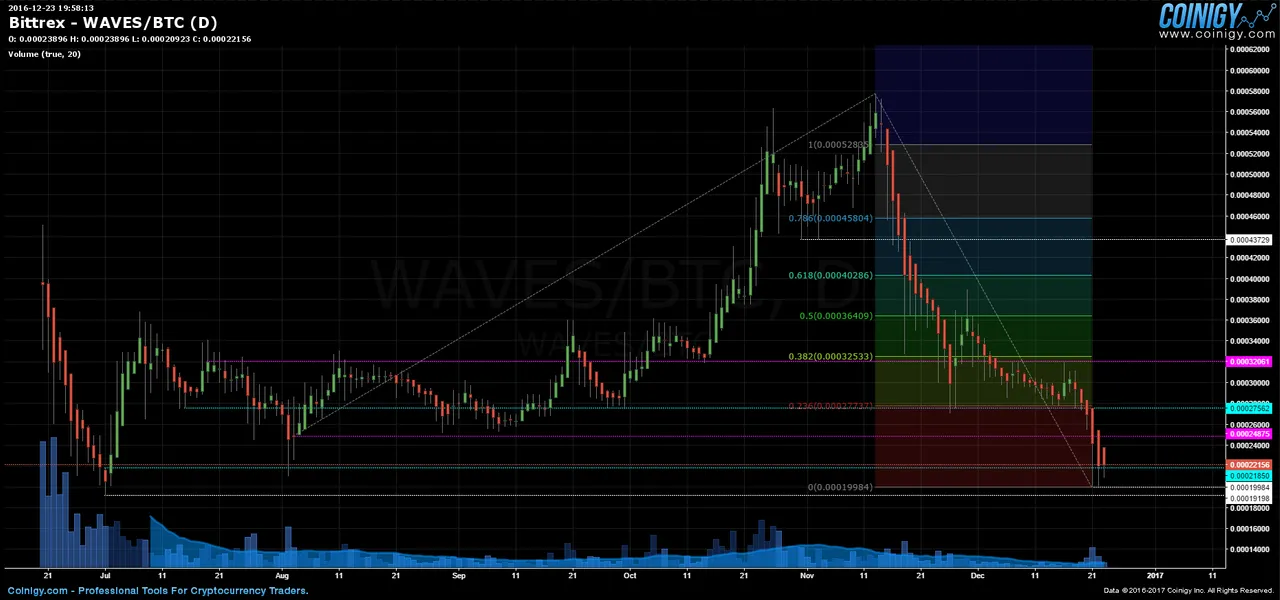
daily chart Bittrex -fib - Dec. 23, 2016
The fib shows a major accumulation area from the recently made local low at 20k to the ~27.5k satoshi line with another fib line around the 32k line.
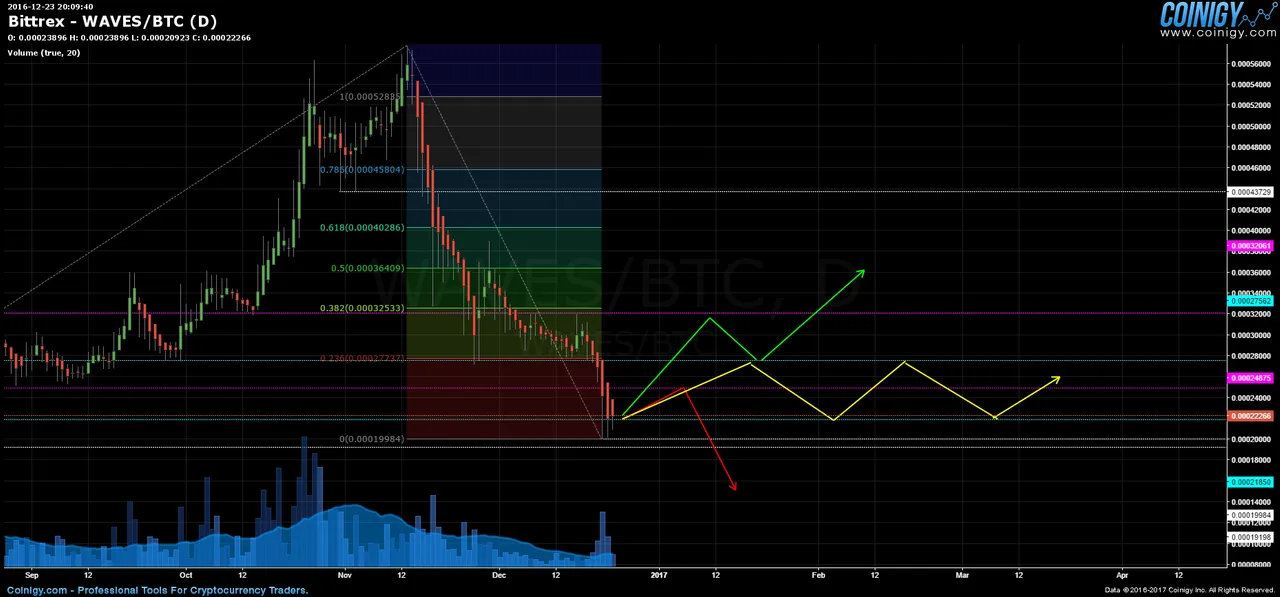
1st (green) - The price enters a hard uptrend breaking the top of the first accumulation level (27.5k satoshi) making it a new support then passing the 32k line and going further up.
2nd (yellow) - The price starts a new accumulation period in the zone marked with the blue lines ( 22k - 27.5k satoshi).
3rd (red) - The price does a small bounce to the 25k satoshi line then goes down breaking the all time low and seaks a new one.
COMMENT
Once again, I will post the comment by commenting as it involves my personal opinion!
Thank you for understanding!
If anyone has any questions or need's help fell free to ask, I will try to explain as fast and as best as I can.
Critics, comments, reply's, counters, advice's, etc. are always welcome!
Have my charts helped you in any way?Let me know with a comment below :)
Are there more people who are doing TA?
Please post the links to your TA's posts into the comments as well!
DISCLAIMER
I am showing multiple scenarios on the price movement, in the post itself I do not take any stance, either bullish or bearish. I am not responsible for neither you’re winning nor you're losses upon trading! the "comment" section is my personal opinion and does not mean I have to or do hold any positions in the given market.
Everyone who uses TA develops his own unique charting style, please keep that in mind.

Kind Regards, OZ :)