
SUMMARY
Many are saying that Facebook (FB) will fall flat on its face and that's good for Steemit because FB users will migrate to Steemit. I disagree.
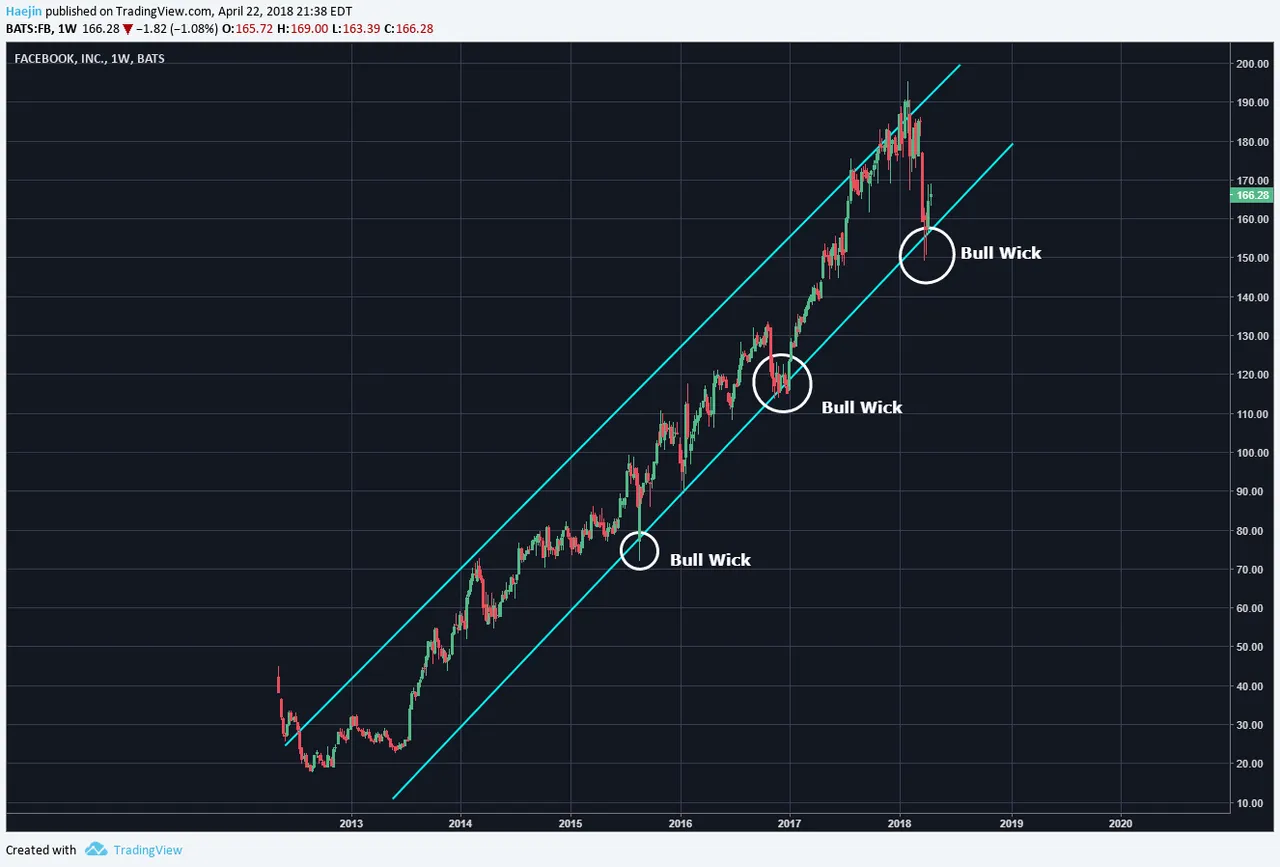
The below chart shows a very handsome looking channel for FB and on three occasions generated a bull wick event (white circles). Price did not in any instance decisively breach the lower trendline. Would you be a buyer or a seller of FB at this point?
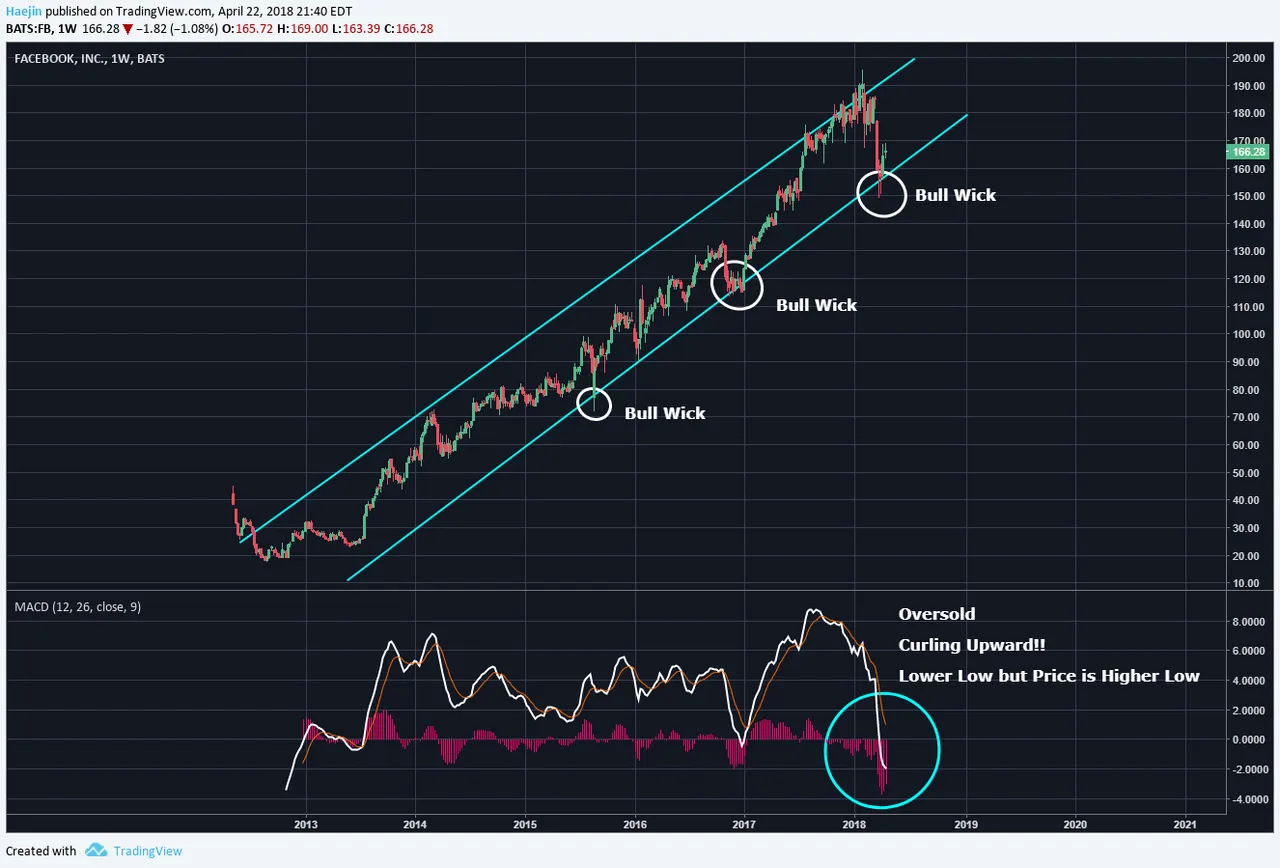
Let's add the MACD. The weekly MACD is showing oversold conditions. The white 12 week moving average is curling upwards, following the trend of the red histogram making higher lows. Price has made higher lows but the MACD Red/White averages is making a lower low. This is a bullish divergence. Would this be the time to be taking BUYING or SELLING actions?
Legal Disclaimer: I am not a financial advisor nor is any content in this article presented as financial advice. The information provided in this blog post and any other posts that I make and any accompanying material is for informational purposes only. It should not be considered financial or investment advice of any kind. One should consult with a financial or investment professional to determine what may be best for your individual needs. Plain English: This is only my opinion, make of it what you wish. What does this mean? It means it's not advice nor recommendation to either buy or sell anything! It's only meant for use as informative or entertainment purposes.
Please consider reviewing these Tutorials on:
Elliott Wave Counting Tutorial #1
Elliott Wave Counting Tutorial #2
Elliott Wave Counting Tutorial #3
Laddering and Buy/Sell Setups.
Laddering Example with EOS
Tutorial on the use of Fibonacci & Elliott Waves
@haejin's Trading Nuggets
Essay: Is Technical Analysis a Quantum Event?
Follow me on Twitter for Real Time Alerts!!
Follow me on StockTwits for UpDates!!
--
--

