SUMMARY
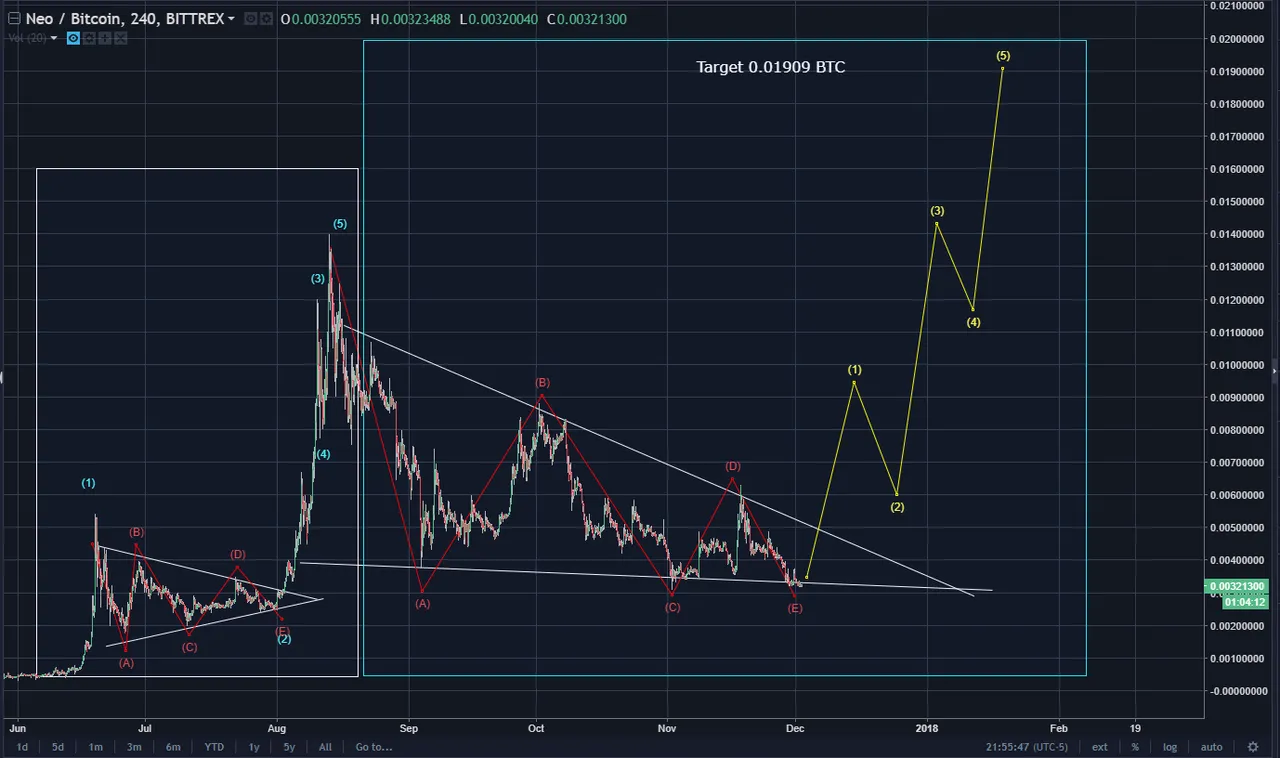
Here is NEO/BTC first because it looks SOOOOO BULISH! This is the congruence of Elliott Waves, Chart Patterns and Fractals saying that price is about to EXPLODE!! Take a look at the white box. The a,b,c,d,e symmetrical triangle inside it exploded and price went veritcal! Now, view the blue box. The symetrical triangle is also a,b,c,d,e but its about 7 times bigger than its fractal! OMG! The a,b,c,d,e is done if not already! Geyser like price EXPLOSION IMMINENT!!
I've updated the Elliott Waves for the NEO/USD pair. Higher highs expected and the $60.47 target is sustained. Perhaps the bull flag pattern could start the fire works.
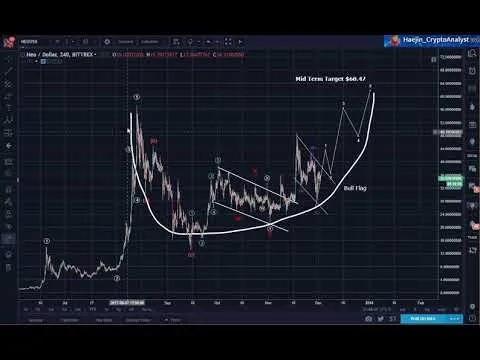
My free hand drawing of the bowl shape pattern is not the prettiest, but price is adhereing to it pretty well.
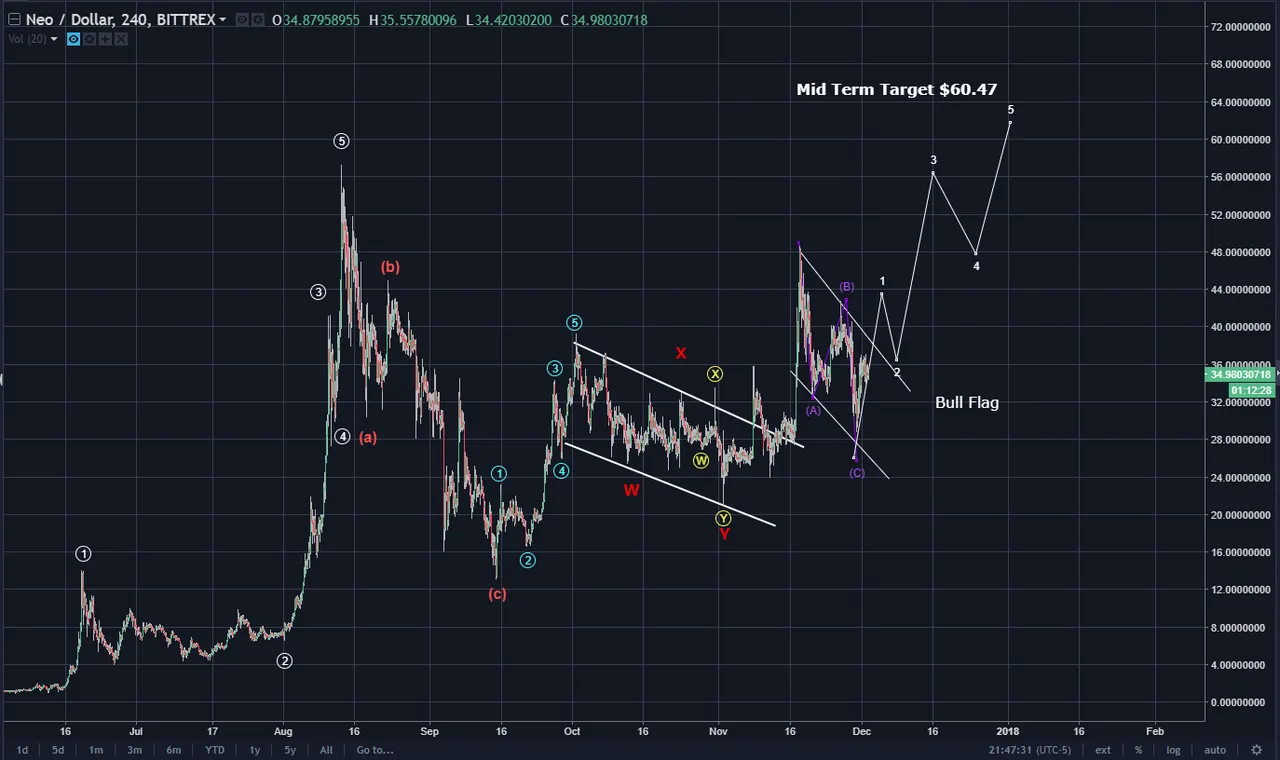
My alternate count is that we NEO could carve out an a,b,c,d,e within the bull flag. Still, no difference, as destination remains the same!

Please consider reviewing these Tutorials on:
Elliott Wave Counting Tutorial #1
Elliott Wave Counting Tutorial #2
Elliott Wave Counting Tutorial #3
Laddering and Buy/Sell Setups.
Laddering Example with EOS
Tutorial on the use of Fibonacci & Elliott Waves
These Technical Analysis Books: Elliott Wave Priniciple & Technical Analysis of Stock Trends are highly recommended
@haejin's Trading Nuggets
Essay: Is Technical Analysis a Quantum Event?
Follow me on Twitter for Real Time Alerts!!
--

If this blog post has entertained or helped you to profit, please follow, upvote, resteem and/or consider buying me a beer:
BTS Wallet - haejin1970
BTC Wallet - 1HMFpq4tC7a2acpjD45hCT4WqPNHXcqpof
ETH Wallet - 0x1Ab87962dD59BBfFe33819772C950F0B38554030
LTC Wallet - LecCNCzkt4vjVq2i3bgYiebmr9GbYo6FQf

Legal Mumbo Jumbo: This is only my opinion, make of it what you wish. What does this mean? It means it's not advice nor recommendation to either buy or sell anything! It's only meant for use as informative or entertainment purposes.**