CryptoKraze here

In this post I am going to cover technical analysis of NEOUSD for short term basis and I am using tradingview charts and price linked to Bittrex exchange. Let' have a look on technical aspects of NEOUSD
Chart on 1 Hour Time Frame
If we look at 1 hour chart and draw a trend line, you will see Neo has bounced perfectly from the trendline and it will continue to move up. Next I am looking at the RSI and it is well below 50 level. At the same time RSI is forming a sharkfin pattern that is sign of reversal, so it is a bullish sign and I am looking to buy it. Now have a look at bollinger bands and we will notice that price is above the median line. There is good space to be covered before price can touch the first upper band.
- I am looking to buy on 1 hour chart base with my take profit levels around 85 to 90.
- Set your Stop Losses as these are must for trading if you don't know the averaging technique.
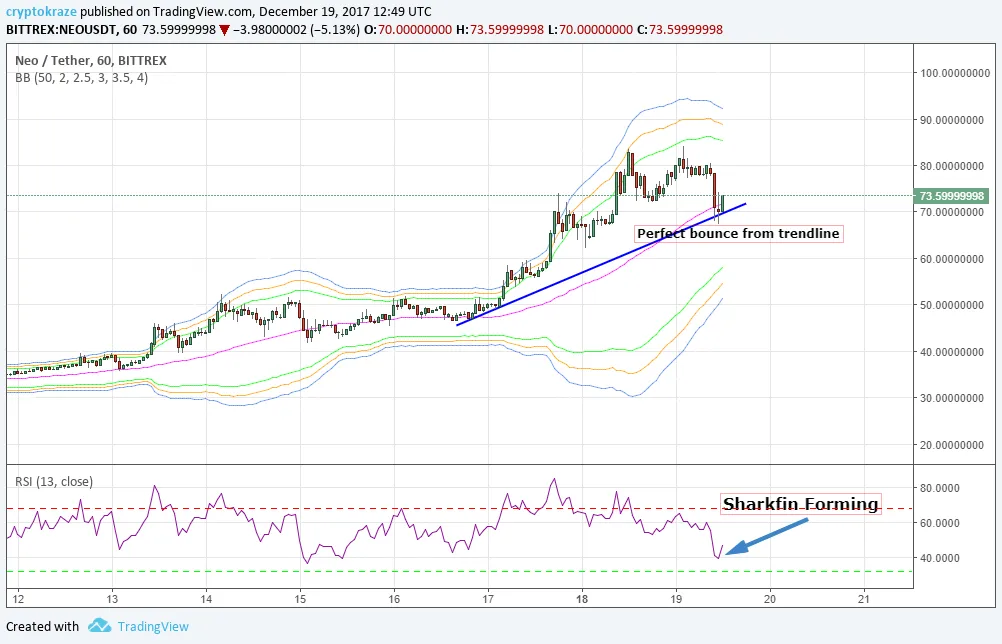
Chart on 30 Minutes Time Frame
On 30 minutes charts Neo has bounced perfectly from the trendline and it will continue to move up. RSI has gone below 30 level and move up now at 45 level . At the same time RSI has formed a sharkfin pattern that is sign of reversal, so it is a bullish sign and I am looking to buy it. Now have a look at bollinger bands and we will notice that price has bounced right from the 3rd lower band and it is superb sign for a short term buy entry. There is good space to be covered before price can touch the first upper band.
- I am looking to buy on 30 minutes chart base with my take profit levels around 82 to 84.
- Set your Stop Losses as these are must for trading if you don't know the averaging technique.
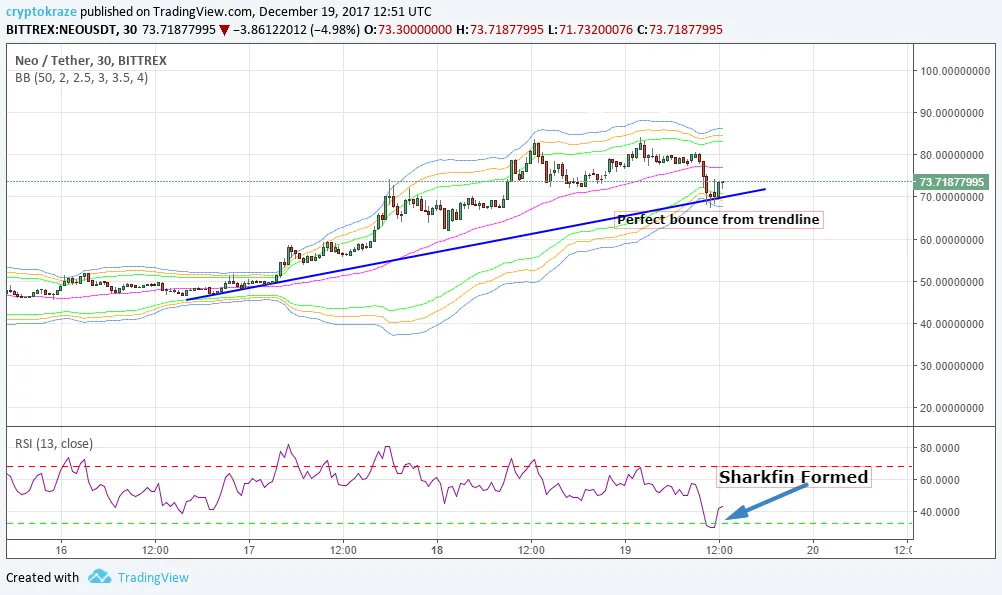
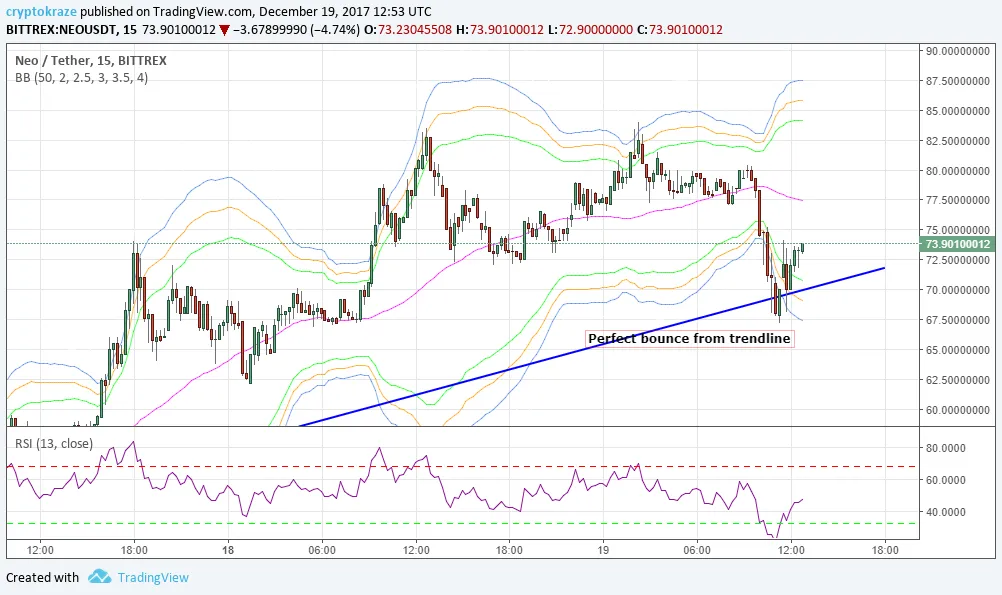
Chart on 15 Minutes Time Frame (Scalp Trade)
If we look at 15 minutes chart RSI has gone below 30 level and move up now at 45 level . At the same time RSI has formed a sharkfin pattern that is sign of reversal, so it is a bullish sign and I am looking to buy it. Now have a look at bollinger bands and we will notice that price has bounced right from the 3rd lower band and it is superb sign for a short term buy entry. There is good space to be covered before price can touch the first upper band.
- I am looking to buy on 15 minutes chart base with my take profit levels around 80 to 82.
- Set your Stop Losses as these are must for trading if you don't know the averaging technique.
Crypto Trading is risky business and you can loss partial or full amount of money. Trade at your own risk with that money only you can afford to lose. Bitcoin unexpected pump or dump will make this analysis void.
