Hey All,
The learning continues as I explore Hive Blockchain data, leveraging DBeave to query HiveSQL uncovering trends, patterns, and insights that deepen my understanding of the network and at the same time play around with the data to plot some graphs using Python - matplotlib and pandas. In todays post we would be seeing three different queries which are::
- Hive Power Up Trend Yearly [Last 1 Year]
- Hive Power Up Trend Monthly And then finally
- Hive Power Up during HPUD days...
I queried the HiveSQL database and then got the output of all these three queries into a .csv file to plot grpahs. So here we go with the first query and its output followed by the graph.
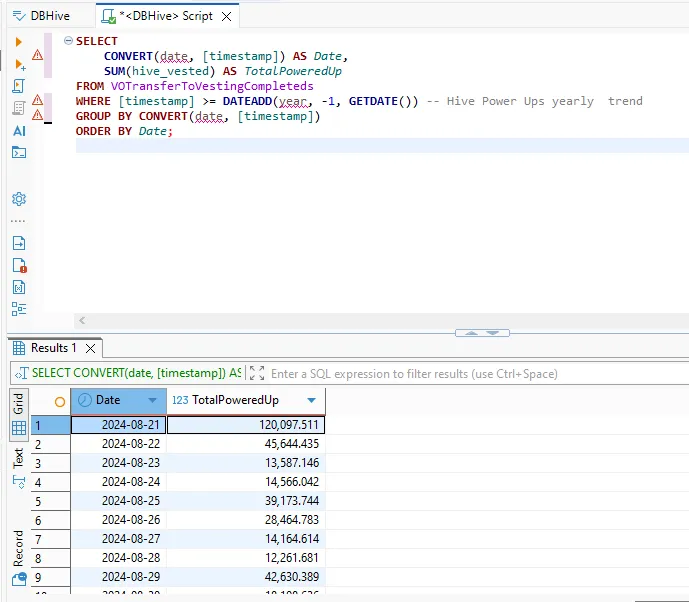
Daily Power-up Trend (last 1 year)
SELECT
    CONVERT(date, [timestamp]) AS Date,
    SUM(hive_vested) AS TotalPoweredUp
FROM VOTransferToVestingCompleteds
WHERE [timestamp] >= DATEADD(year, -1, GETDATE()) -- Hive Power Ups yearly  trend
GROUP BY CONVERT(date, [timestamp])
ORDER BY Date;
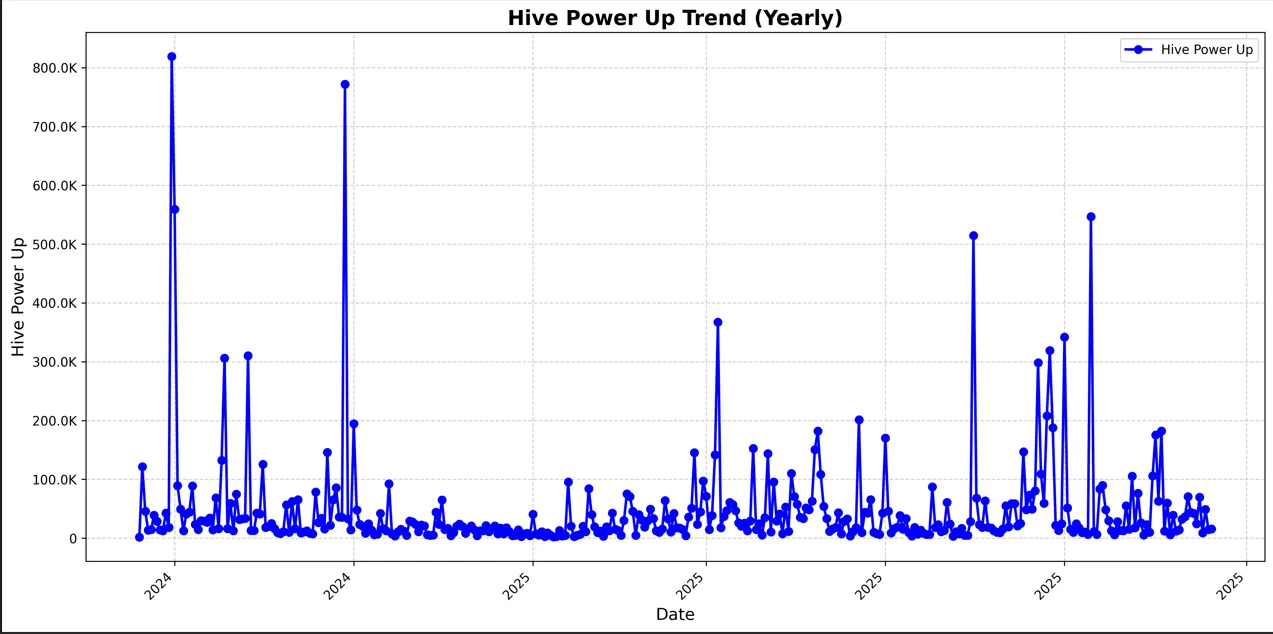
I am not inserting the above query output as it will fill up all the space of this blog post with 365 records. Have a look at the graph above -"hive_powerup_trend_yearly" showcasing the hive being powered up during each day for the year. There are some noticable days where we see hive power up more than 800K+ and some days above 500K+ and near around 400K+ as well. Up next is the seeing the Hive power up on a monthly basis.
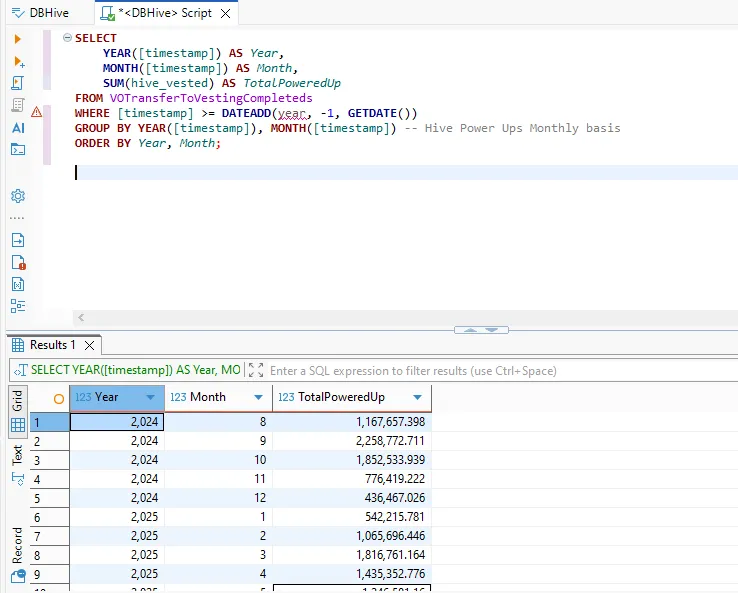
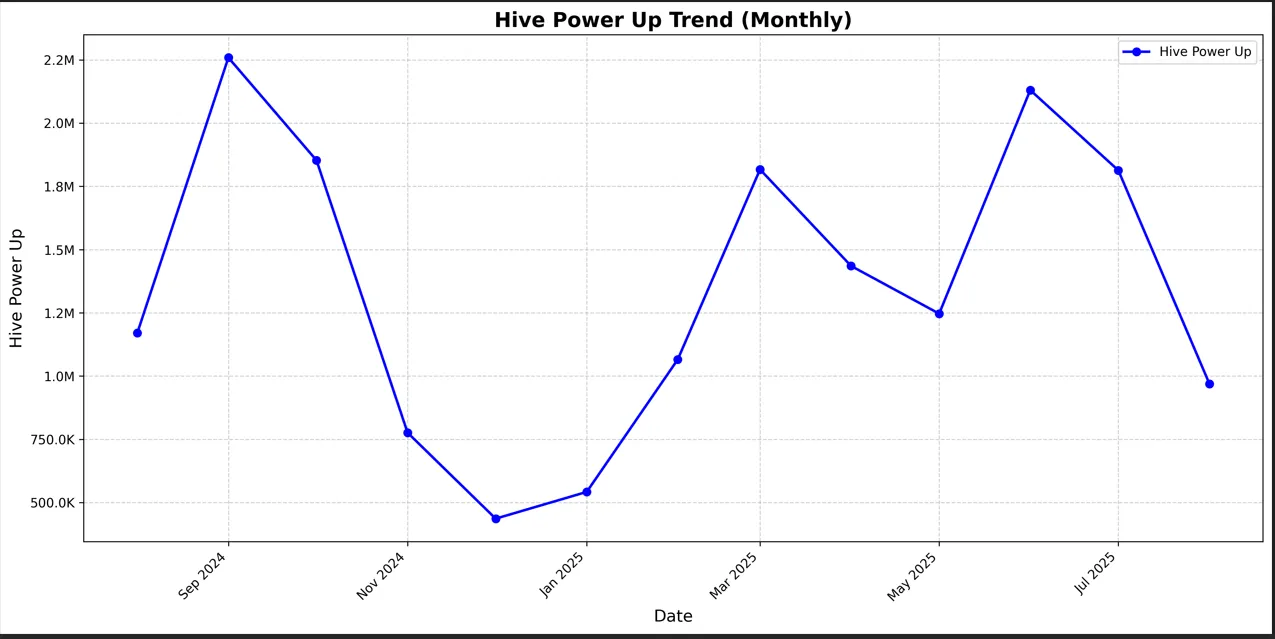
Monthly Hive Power-up Trend (last 1 year)
SELECT
    YEAR([timestamp]) AS Year,
    MONTH([timestamp]) AS Month,
    SUM(hive_vested) AS TotalPoweredUp
FROM VOTransferToVestingCompleteds
WHERE [timestamp] >= DATEADD(year, -1, GETDATE())
GROUP BY YEAR([timestamp]), MONTH([timestamp]) -- Hive Power Ups Monthly basis
ORDER BY Year, Month;
Here is the out of the query and the graph plotted using phython.
| Year | Month | Total Powered Up |
|---|---|---|
| 2024 | 8 | 1,167,657.398 |
| 2024 | 9 | 2,258,772.711 |
| 2024 | 10 | 1,852,533.939 |
| 2024 | 11 | 776,419.222 |
| 2024 | 12 | 436,467.026 |
| 2025 | 1 | 542,215.781 |
| 2025 | 2 | 1,065,696.446 |
| 2025 | 3 | 1,816,761.164 |
| 2025 | 4 | 1,435,352.776 |
| 2025 | 5 | 1,246,581.160 |
| 2025 | 6 | 2,130,434.564 |
| 2025 | 7 | 1,813,134.801 |
| 2025 | 8 | 971,682.331 |
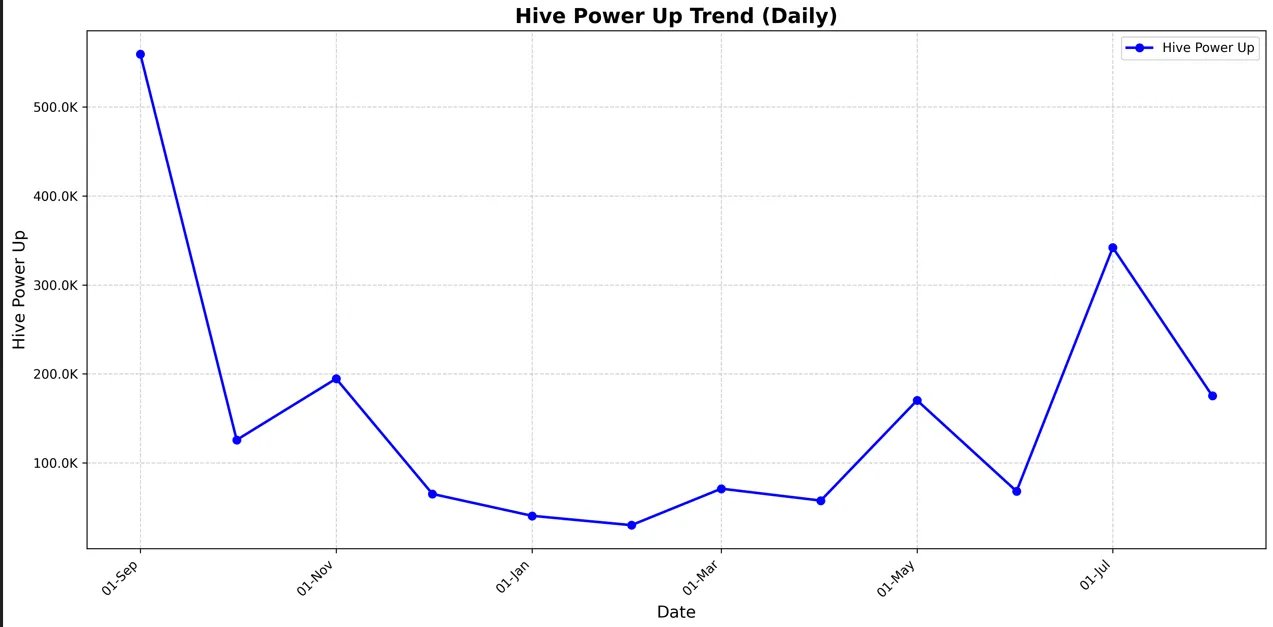
And now finally coming to the last part which is checking on the trend for #HIVE power up during the HPUD days.
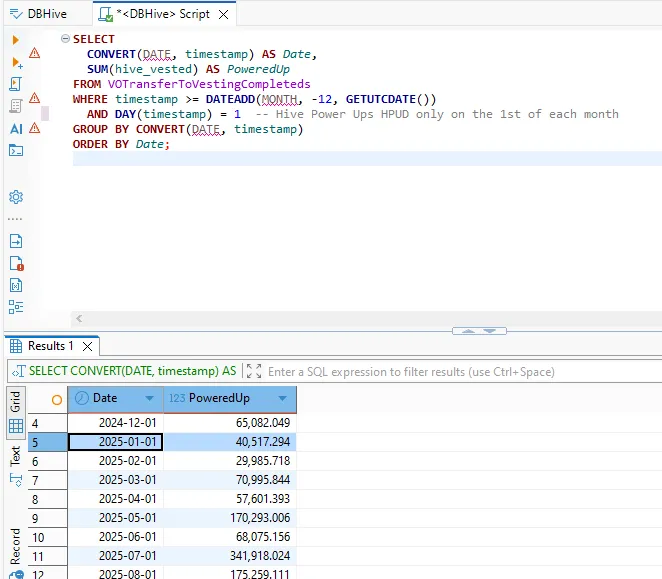
PowerUps on first day of month, last 12 months
SELECT
  CONVERT(DATE, timestamp) AS Date,
  SUM(hive_vested) AS PoweredUp
FROM VOTransferToVestingCompleteds
WHERE timestamp >= DATEADD(MONTH, -12, GETUTCDATE())
  AND DAY(timestamp) = 1  -- Hive Power Ups HPUD only on the 1st of each month
GROUP BY CONVERT(DATE, timestamp)
ORDER BY Date;
Here is the query output and the grpah plotted.
| Date | Powered Up |
|---|---|
| 2024-09-01 | 559,277.391 |
| 2024-10-01 | 125,782.765 |
| 2024-11-01 | 194,605.034 |
| 2024-12-01 | 65,082.049 |
| 2025-01-01 | 40,517.294 |
| 2025-02-01 | 29,985.718 |
| 2025-03-01 | 70,995.844 |
| 2025-04-01 | 57,601.393 |
| 2025-05-01 | 170,293.006 |
| 2025-06-01 | 68,075.156 |
| 2025-07-01 | 341,918.024 |
| 2025-08-01 | 175,259.111 |
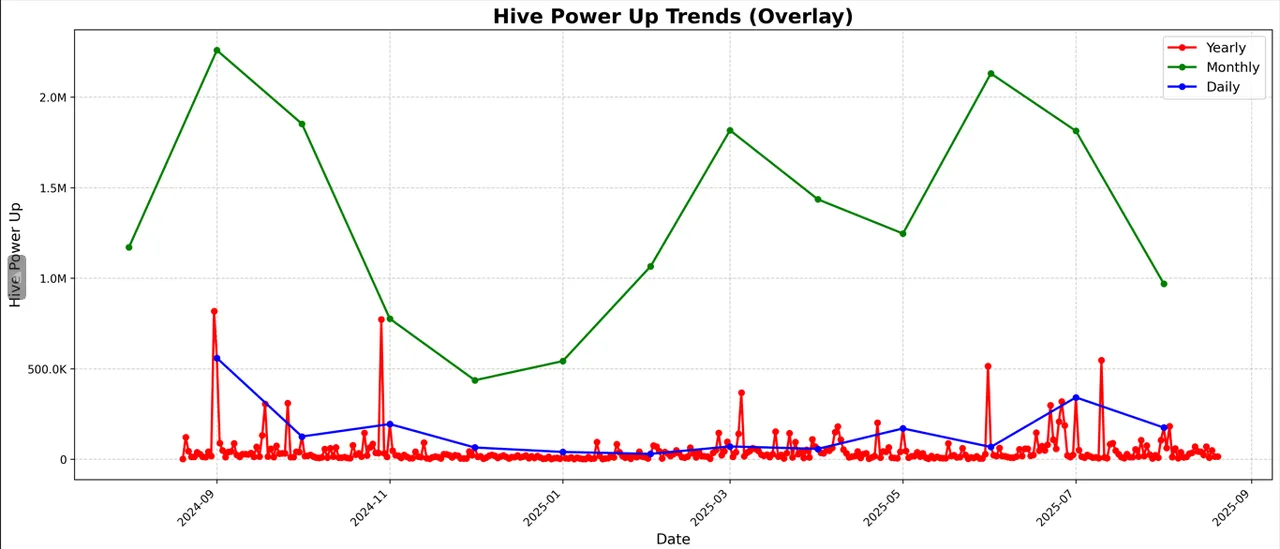
Overall, it was a great learning experience to pull records, explore, and observe the Hive Power-Up Trends: Yearly, Monthly, & During Hive Power-Up Day. It’s always insightful to see how Hive Power fluctuates over time, and how community activity peaks during Power-Up Days. This analysis not only deepens understanding of the Hive network but also highlights patterns of engagement and growth. Do you agree? That’s all for today’s post on “Hive Power-Up Trends: Yearly, Monthly & During Hive Power-Up Day – Learn as You Explore..” I hope I was able to explain things clearly. If you have any follow-up questions or doubts, please feel free to share them in the comments below. Happy Learning with HiveSQL....Cheers...before I end here is the final image plotted showcasing the overall of all the three graphs above Yearly, monthly and first day of the month #hive power up.
Hive Power-Up Trends: Yearly, Monthly & During Hive Power-Up Day – Learn as You Explore...
#Hive #Blockchain #Crypto #HiveSQL #PowerUpTrend #HiveCommunity #Web3 #Decentralization #HiveBlog
Best Regards
Paras
Image Courtesy:: pro canva license, hiveblocks, DBeaver
PS:- None of the above is a FINANCIAL Advice. Please DYOR; Do your own research. I've have an interest in BlockChain & Cryptos and have been investing in many emerging projects.
📚 My Earlier HiveSQL - Hive Blockchain Data Related Blogs
- Hive Reputation Explained: Part2 - HIVE POWER & HIVE REPUTATION - Analysis
- Hive Reputation Explained: Step-by-Step Conversion Guide
- HiveSQL - Current - Hive Token Supply Distribution Numbers... Liquid HIVE, HIVE POWER & HBD Supply
- My Daily Hive Earnings Breakdown — July 2025 - Hive Power & HBD - ALL #HIVE Earnigs Powered UP
- Hive Blockchain Explained: What Are "Delayed Votes" on HiveBlocks? - Explained with an EXAMPLE
- HiveSQL - Top 50 #HIVE Reputable Users - HIVE POWER & #HBD in Savings they #HODL
- HiveSQL - Querying Json_metadata with App = "Ecency"
- HiveSQL - Querying to find out HIVE Coming IN [Users] & Going OUT [Exchanges]
- Started using HiveSQL and my FIRST Simple query - Top 50 accounts #HOLDING Liquid HIVE - Eliminated Accounts having more than a Million #HIVE