
The terms Bears and Bulls in the stock market come from how these animals attack their prey. Bears will tear those down to the ground with their claws and teeth while Bulls will lift them up with their horns.
#3 Bearish Chart Patterns
These are patterns that indicate a higher probability of the price going down. These are the 3 bearish patterns that are most common.
1 Head & Shoulders
2 Double Top
3 Descending Triangle
1 Head & Shoulders
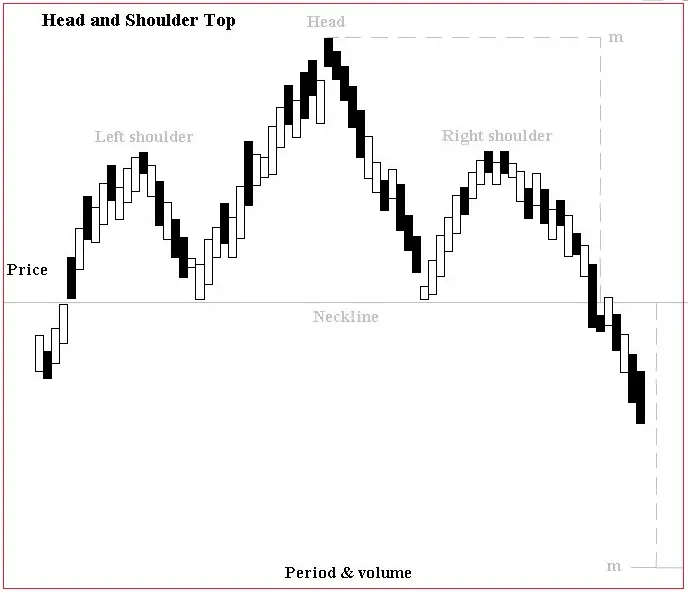
This pattern consists of
Left Shoulder = First Peak
Head = 2nd Peak
Right Shoulder = 3rd Peak
Neckline = Connection line between bottoms in between the 3 peaks. The moment this breaks after the 3rd peak, the Head & Shoulders pattern is complete and a move down is very likely.
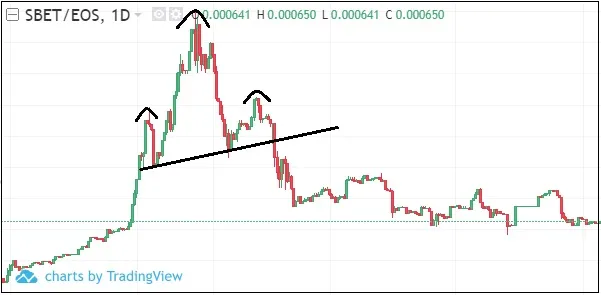
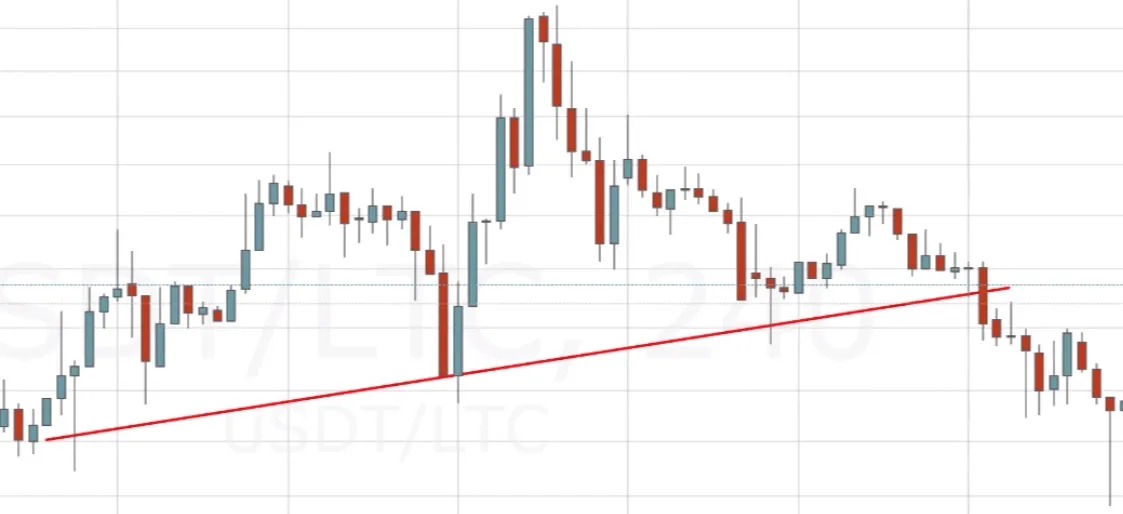
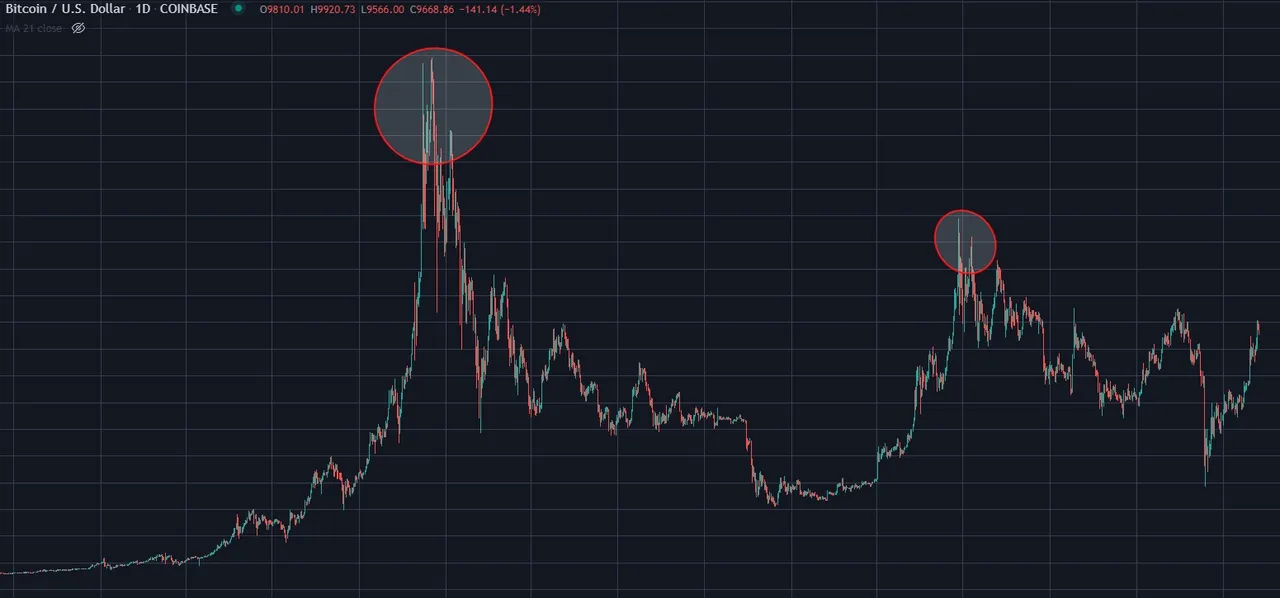
Some clear examples:
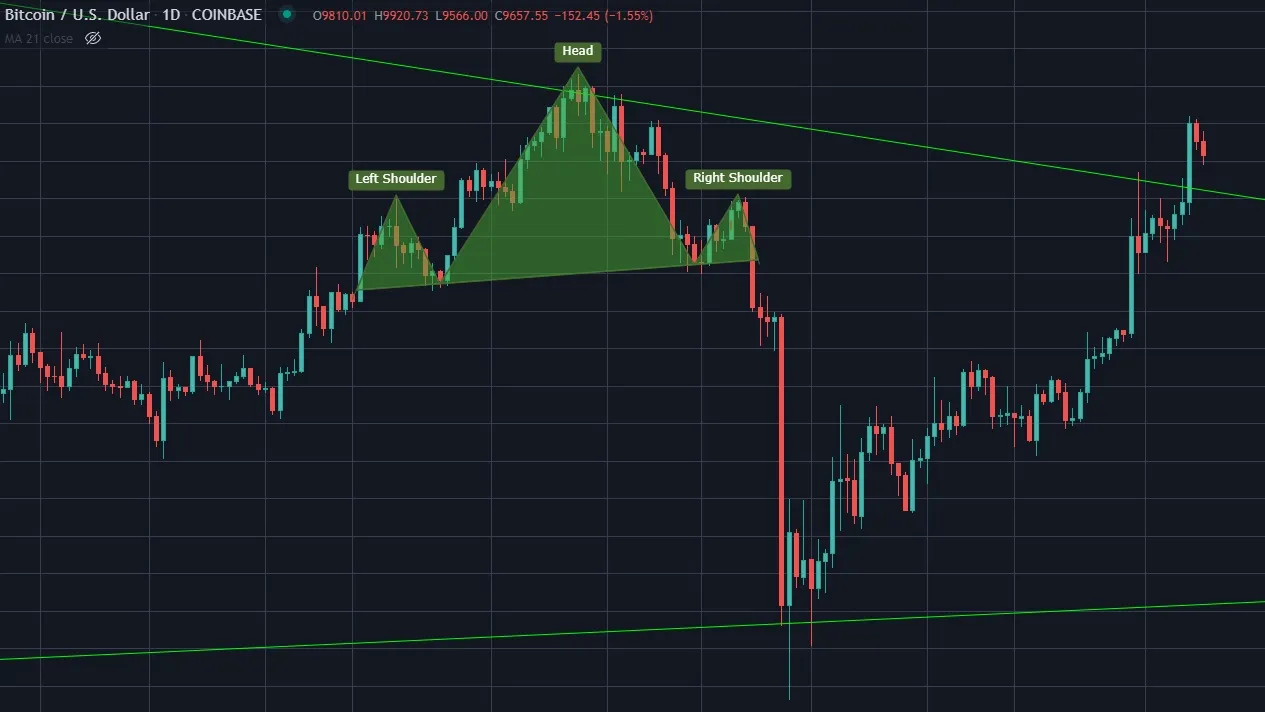
The Head & Shoulders pattern is not always obvious and a couple of rules apply.
- The right Shoulder is often a bit lower compared to the left shoulder but this doesn't have to be the case.
- The neckline doesn't have to be horizontal and can have an angle
- The time between both heads and shoulders doesn't have to be similar, one of the shoulders can take a much longer time to form.
There is a tool in Tradingview that allows you to clearly draw the head & Shoulders Pattern.
2 Double Top
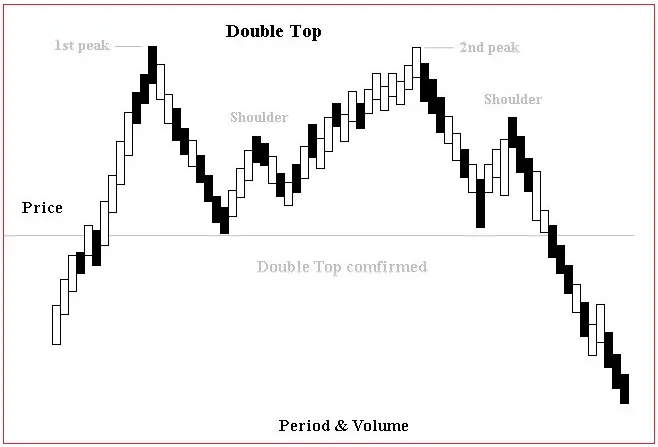
The psychology behind the double top is that the market starts to rally again after making a top seeing a lot of extra sellers come in who missed the previous top or people that bought the previous top to see it quickly go down now being at a point where they are almost break-even which allows them to get out.
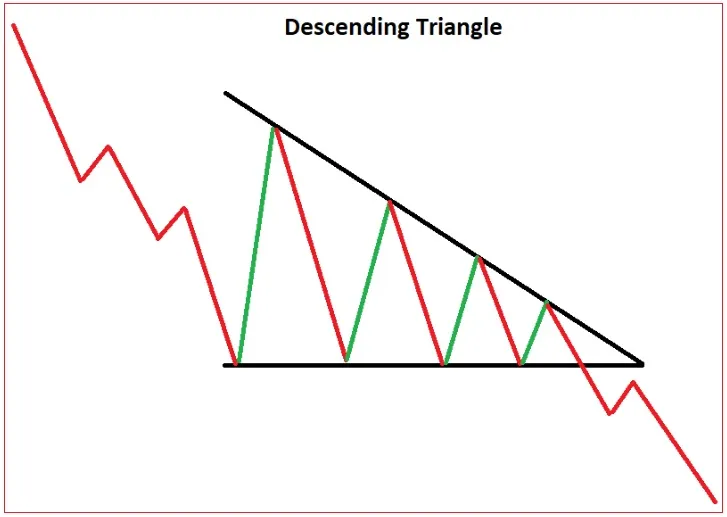
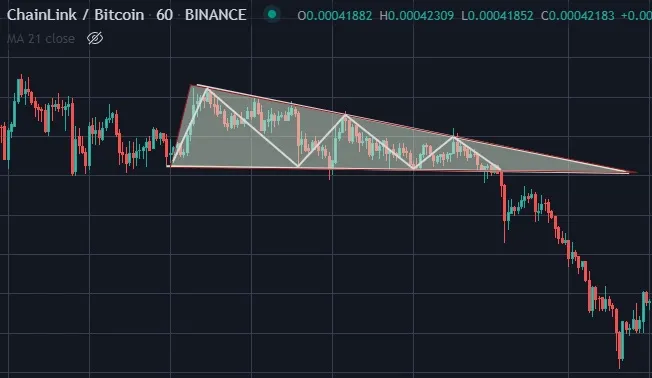
3 Descending Triangle
Example:
Previous Technical Analysis Lessons
Technical Analysis #1 | Basics
Technical Analysis #2 | Trends
Free Software I use for Charts
Tradingview
|
|
|
|