Good day Hiveians!
Join me in analyzing the crypto markets!
Hive is still underperforming
Although I am sure that it is only a matter of time before Hive makes a bigger push upwards again, Hive continues to make lower lows. Just several days ago we hit ~27 cents; this leaves the door open for a continuation of lower lows.
In this post I want to revisit some older posts which gave a bear market outlook that have been fairly accurate as well as outline three future scenarios.
In June of this year I discussed the channel that Hive was moving in. At the time we were moving in an ascending channel, but I discussed the possibility of heading lower and establishing a parallel channel. Here is the chart again:
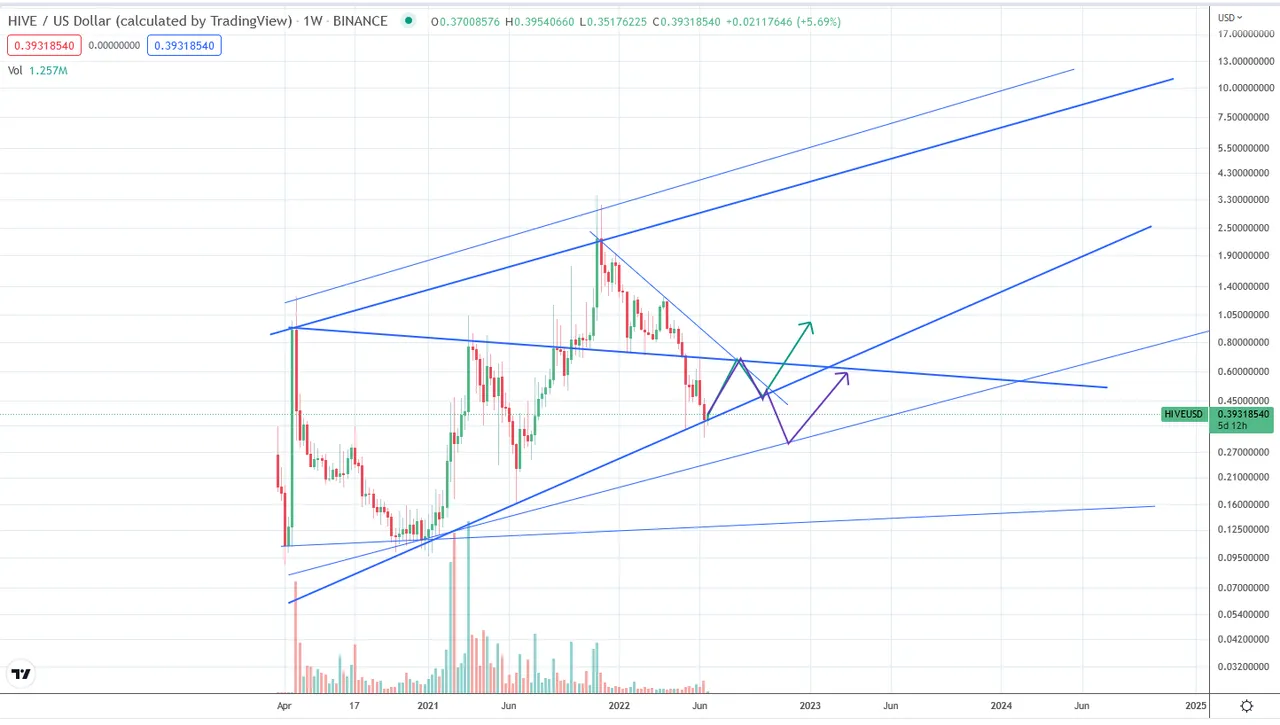
The purple scenario turned out to be very accurate and we had been in this new parallel channel for some weeks before we went down lower. I would argue now that this parallel channel has also failed. It was never really strong to begin with; the strongest case for it was the fact that many coins move in such channels. So a failure does not necessarily mean that the price is in free fall.
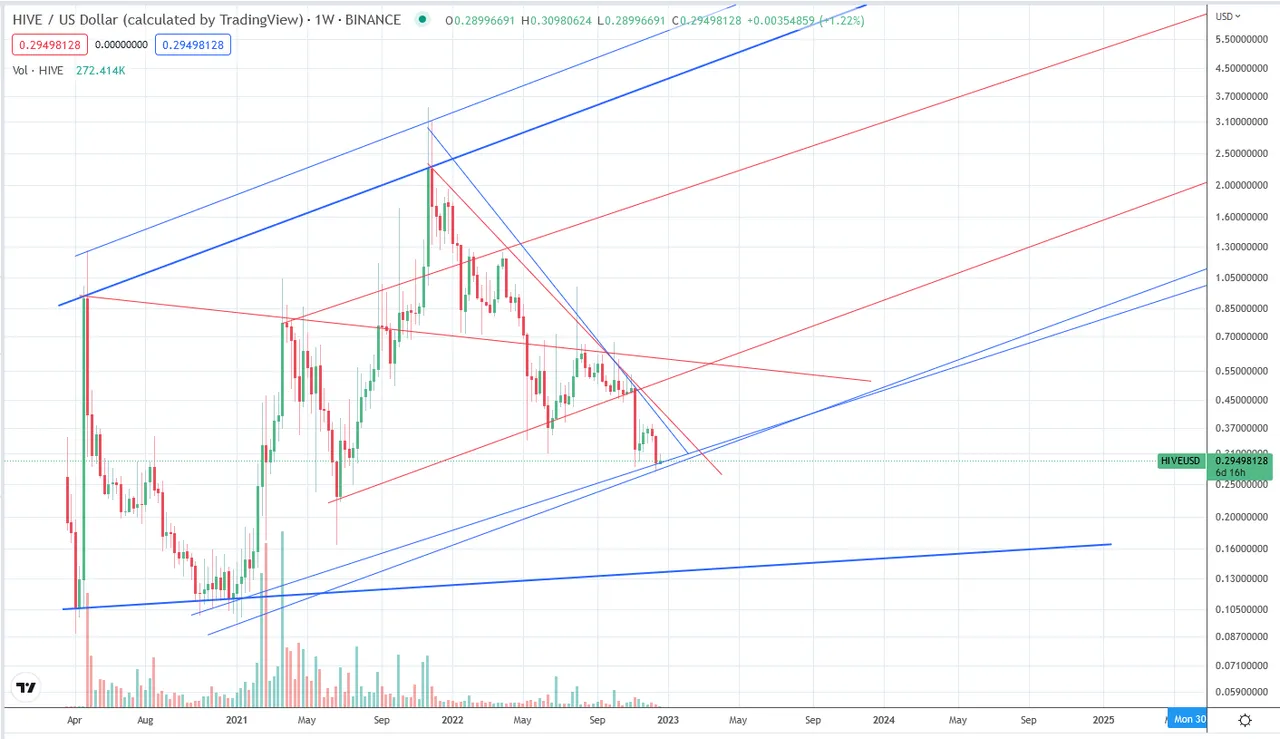
However, the next good support in the weekly chart is very much at the bottom. In May I highlighted such an "ultimate bear market" scenario, which we have to revisit now. Here is the chart:
As you can see the next support here is at around 13-15 cents. One caveat with this trend line, however, is that the first point of support comes from only several weeks after Hive was listed. So this data point is not too strong.
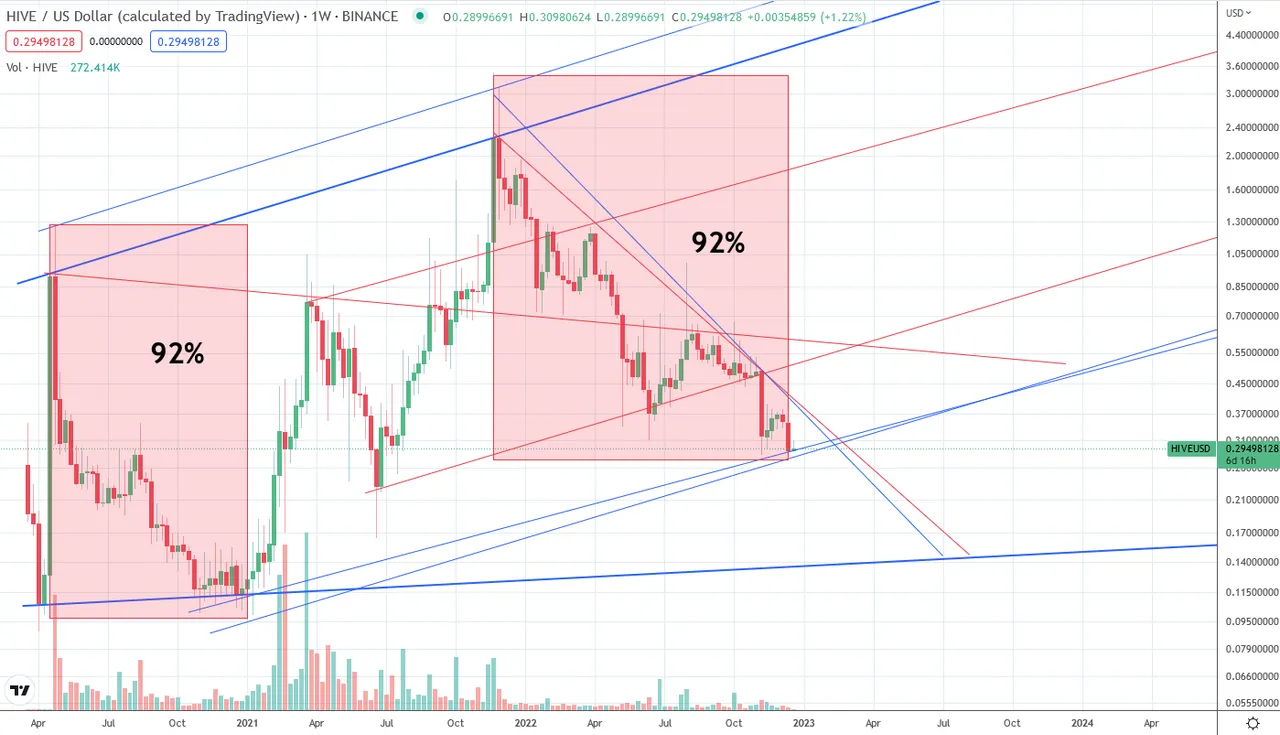
The new updated chart looks like this:
Until price holds at current levels (and above) the next good support is at this low range. After the Head and Shoulder Pattern, this is of course a real possibility, but price is already down 92% which is also exactly the amount when Hive had its first bigger correction. Were price to head to 13-15% this would correspond to a 96% correction. Not impossible, but increasingly unlikely.
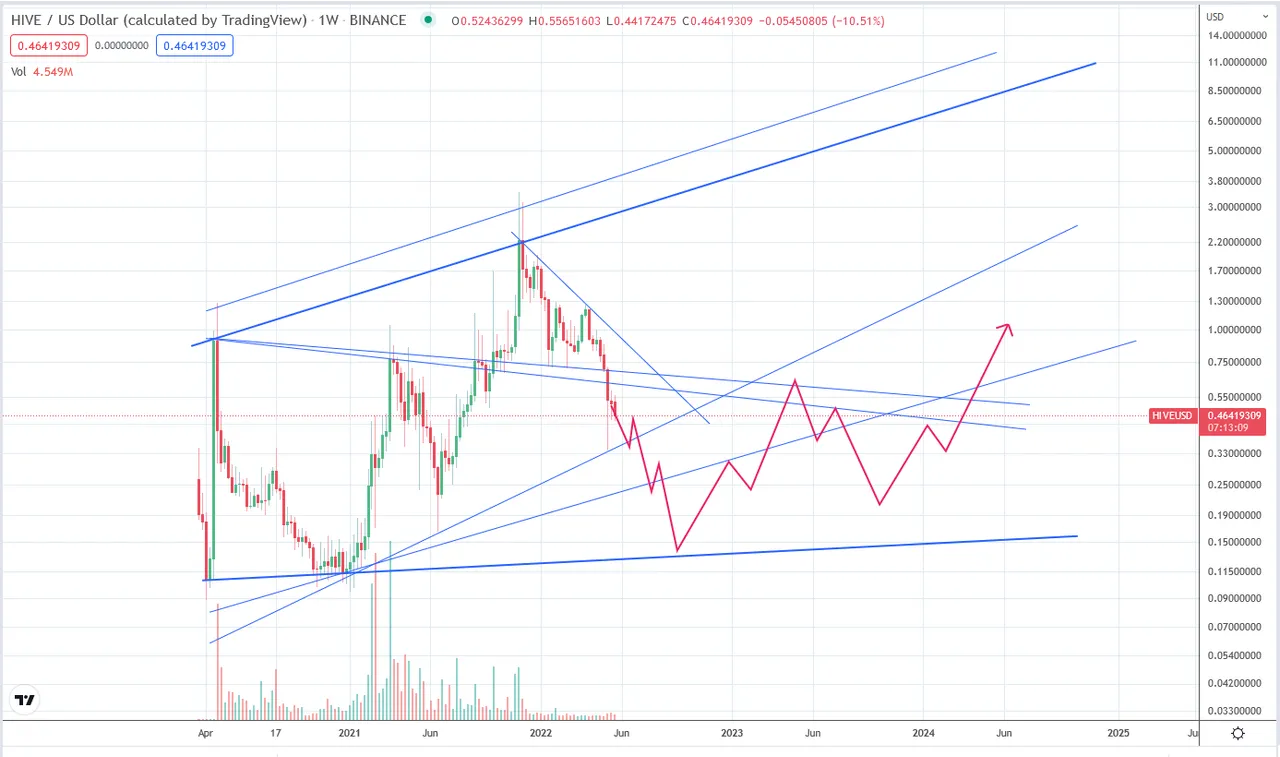
The three scenarios that I currently see are seen here:
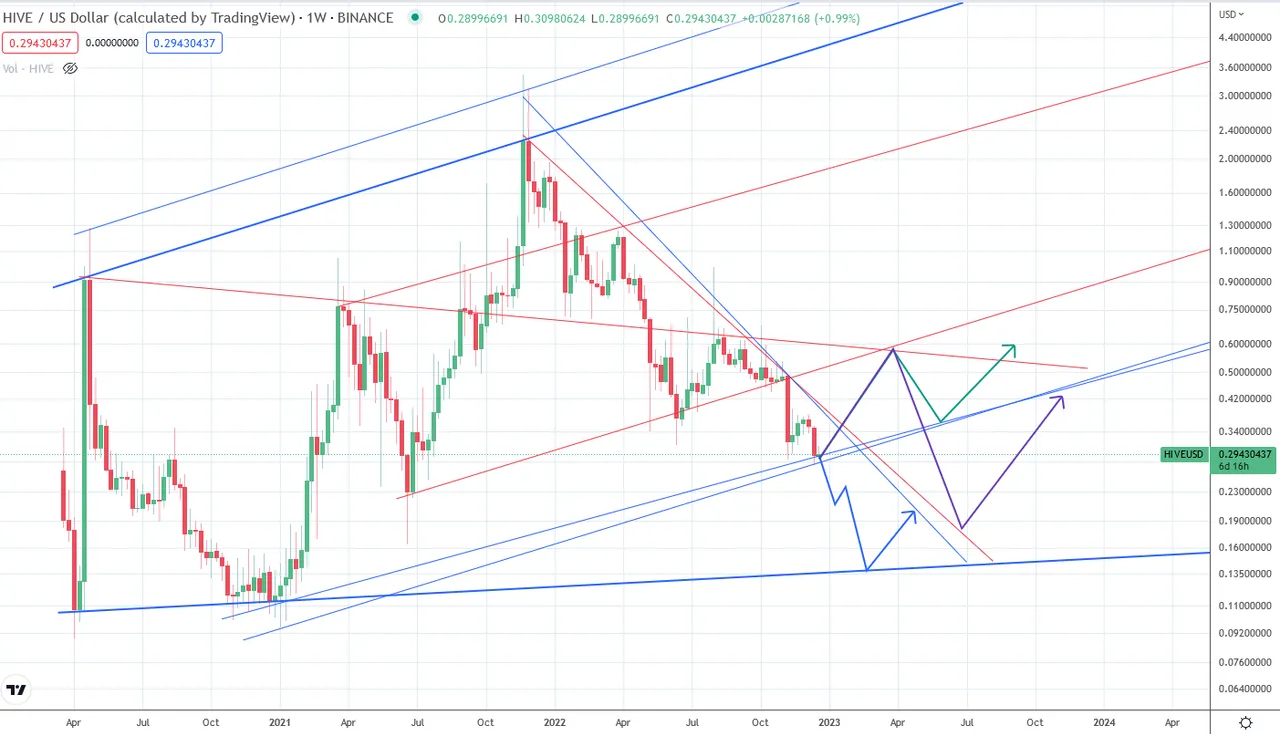
The least likely seems to be the green one which would essentially mean that current lows have marked the low for this bear market. Also unlikely seems to me the blue one which would just see a continuation of price decline until the aforementioned support. What I see as a reoccuring fractal is the purple one. You can see this pattern in all of the peaks: a peak and then two smaller ones to the right. If so, we could see 50-60 cents in spring and in summer 2023 a low of about 18 cents. This would then be the low for this cycle.
As a general reminder: Please keep in mind that none of this is official investment advice! Crypto trading entails a great deal of risk; never spend money that you can't afford to lose!


Check out the Love The Clouds Community if you share the love for clouds!