Good day Hiveians!
Join me in analyzing the crypto markets!
Hive is now near the macro support I talked about last month
In that post I stated that Hive's path seemed clear: a revisit to the macro support before we'd have a chance for a reversal. Here is the chart of the last post with an outlined possible path trajectory:
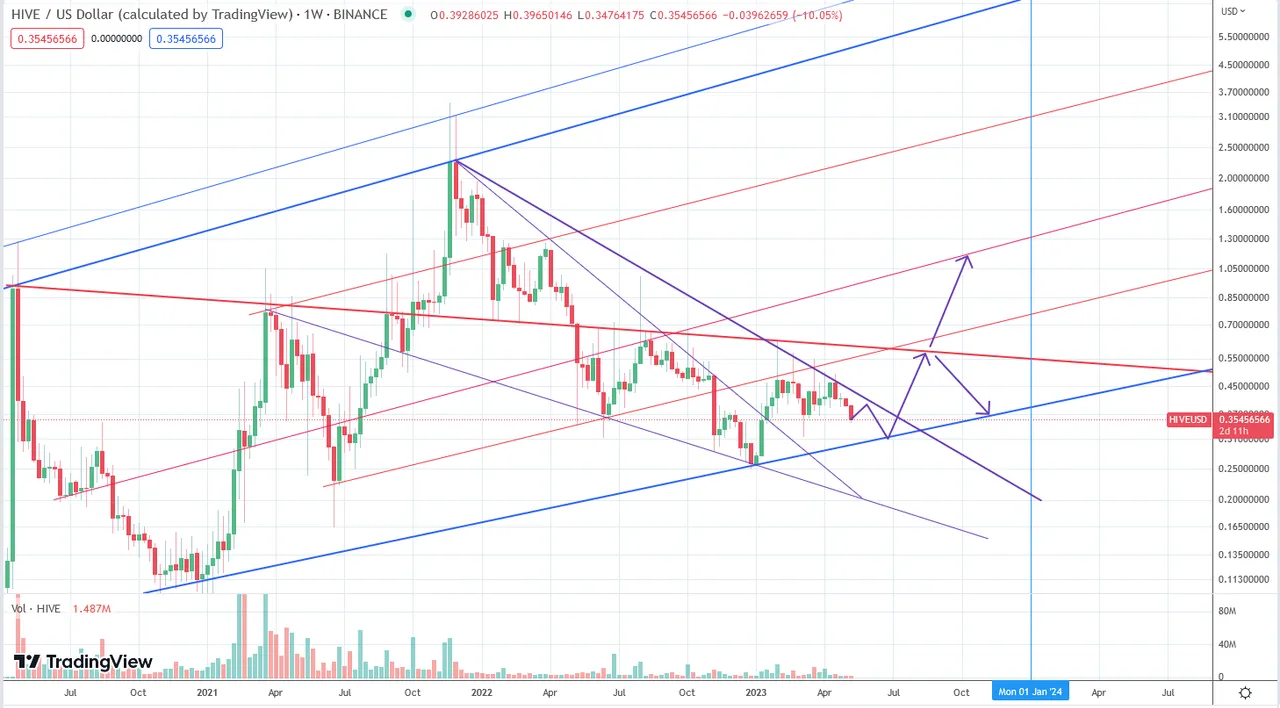
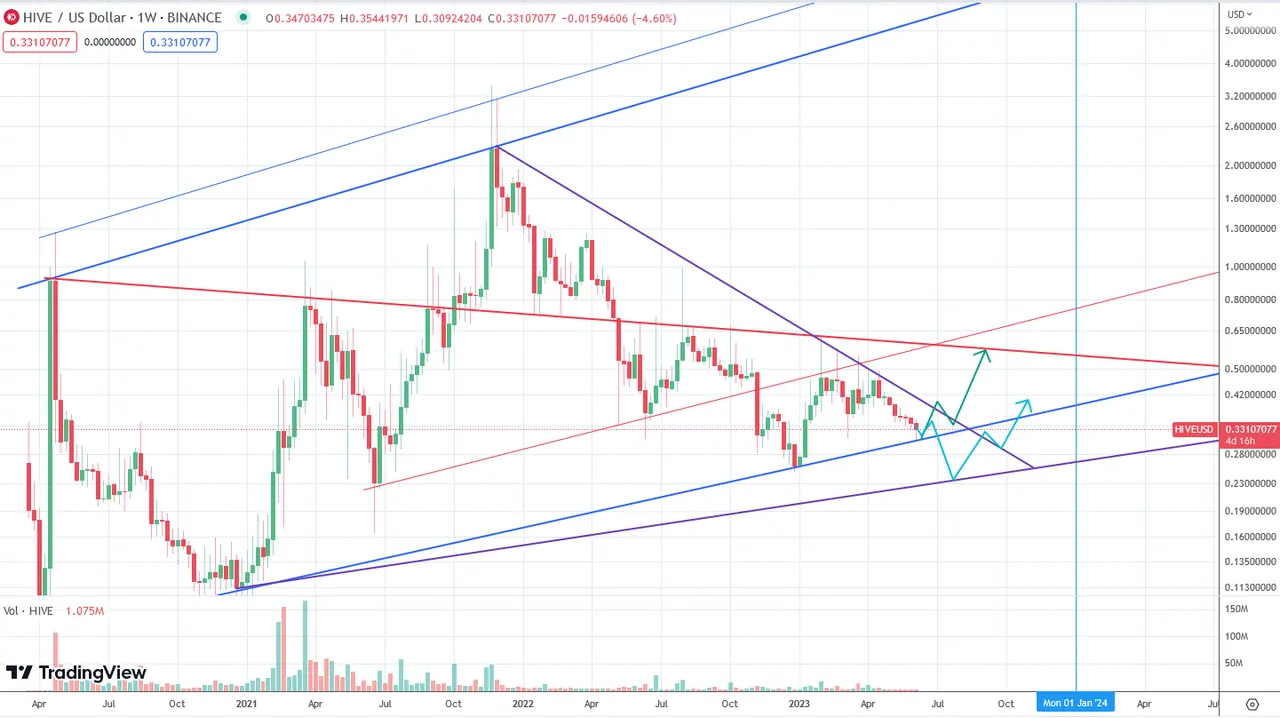
Yesterday we saw a bigger sell off (nothing dramatic) which brought Hive near to 30 cents and thereby to the thick blue line which acts as our macro support. So before anymore TA, let's have an updated look at the situation:
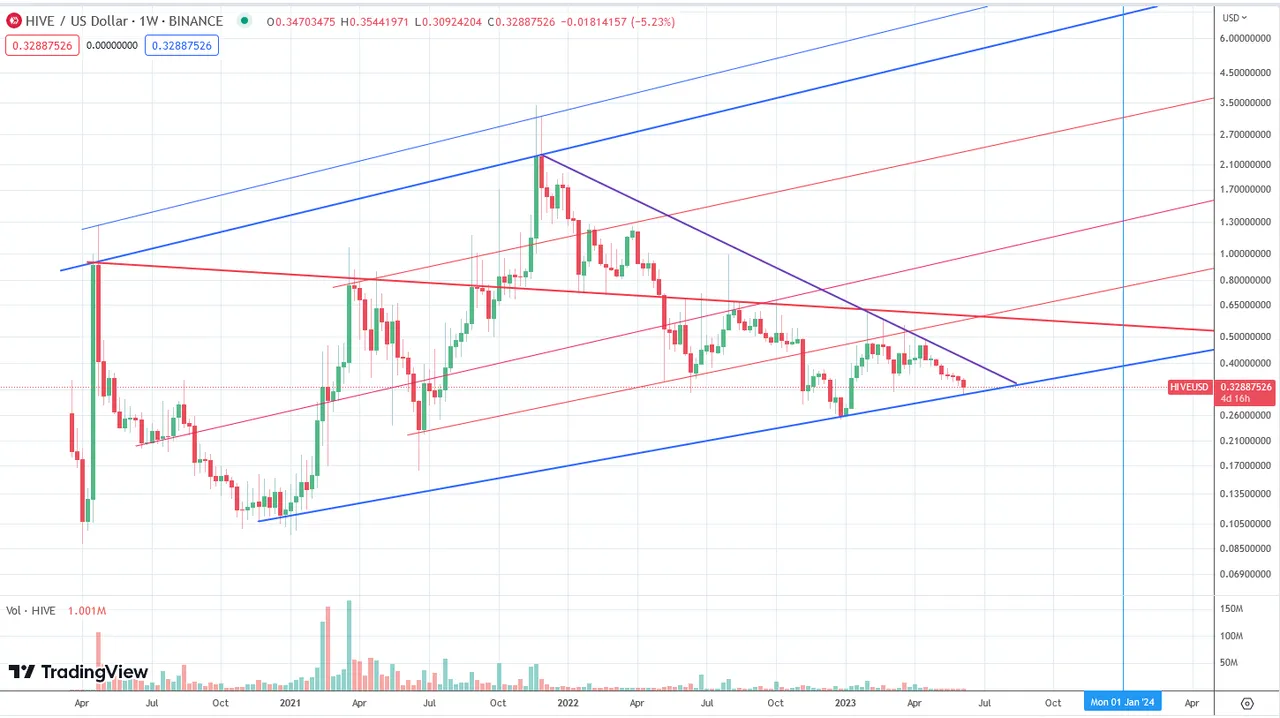
Keep in mind that this is the weekly chart. Here we can see a wick going down to the blue line. Since this shows the bigger picture it is well possible that price is still going to head a bit lower so that we get a weekly candle close on this support. But essentially we made contact. The next days and weeks will therefore be very interesting to watch. Can this support hold and Hive's price bounce?
While the market will always have the final say, there is one indicator that could suggest a price reversal: the fib ratio. But to mention it right away, there is an obvious caveat that would allow price to go about 30% lower. But my point is that a reversal seems to be very near in any case.
The fib ratio is something I talked about a lot in the past and also in the last post. If you read it you will see the importance of the 0.236 fib ratio area. This has so far always indicated a price reversal. Will it work once again?
There are two way in which we can apply the technique - to the candles and/or the wicks. Let's first start with the wicks. If we use the base of the macro uptrend in 2021 and it's conclusion in fall of that year (as a wick) we get this:
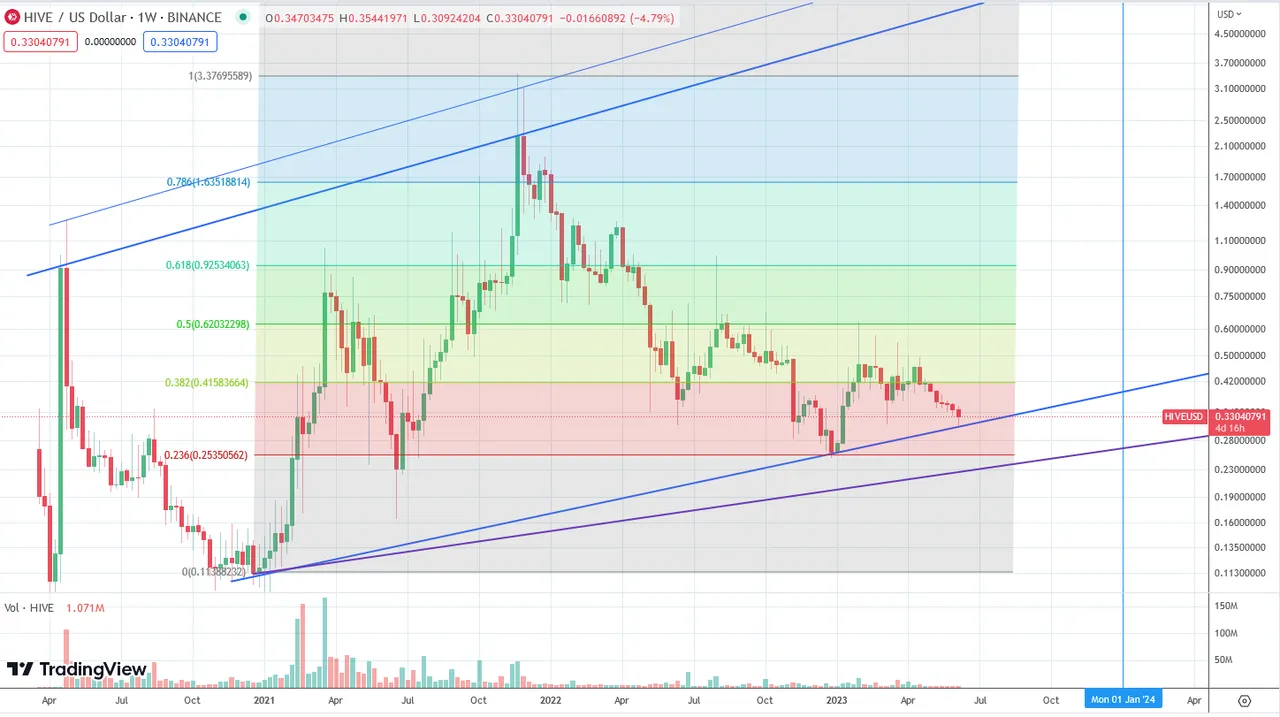
This fits perfectly into the chart: Price has already bounced off of the 0.236 ratio in early 2023 which is why I have said that we are now in a bull market. If so, we could expect price to hold at the blue macro support and continue the larger uptrend.
But when we apply this technique to the candles the picture is a bit different. The peak of the candle is much lower at around $2.2 and so we get this:
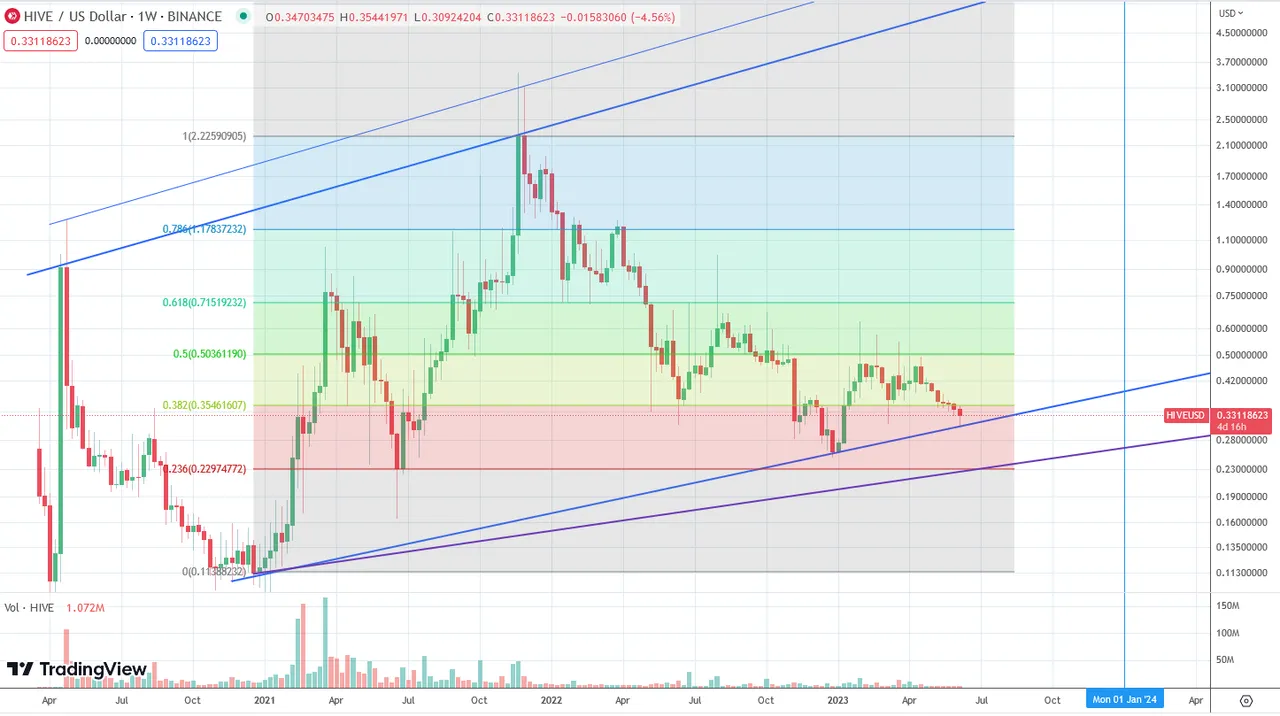
If this is actually the correct way to apply the indicator then it would suggest a price bottom at around 22 cents. This is lower than the previous low at around 25 cents and on par with the price correction we saw in 2021.
Both ways in applying the technique seem to be valid. We will have to see and wait what will work out better. However, the positive news is that both applications seem to suggest a price reversal. I doubt that price would head lower than 22 cents since this indicator has worked extremely well so far with Hive. So finally, here are the two scenarios to watch out for:
As a general reminder: Please keep in mind that none of this is official investment advice! Crypto trading entails a great deal of risk; never spend money that you can't afford to lose!


Check out the Love The Clouds Community if you share the love for clouds!