COULD NEO GO TO $120?!?!
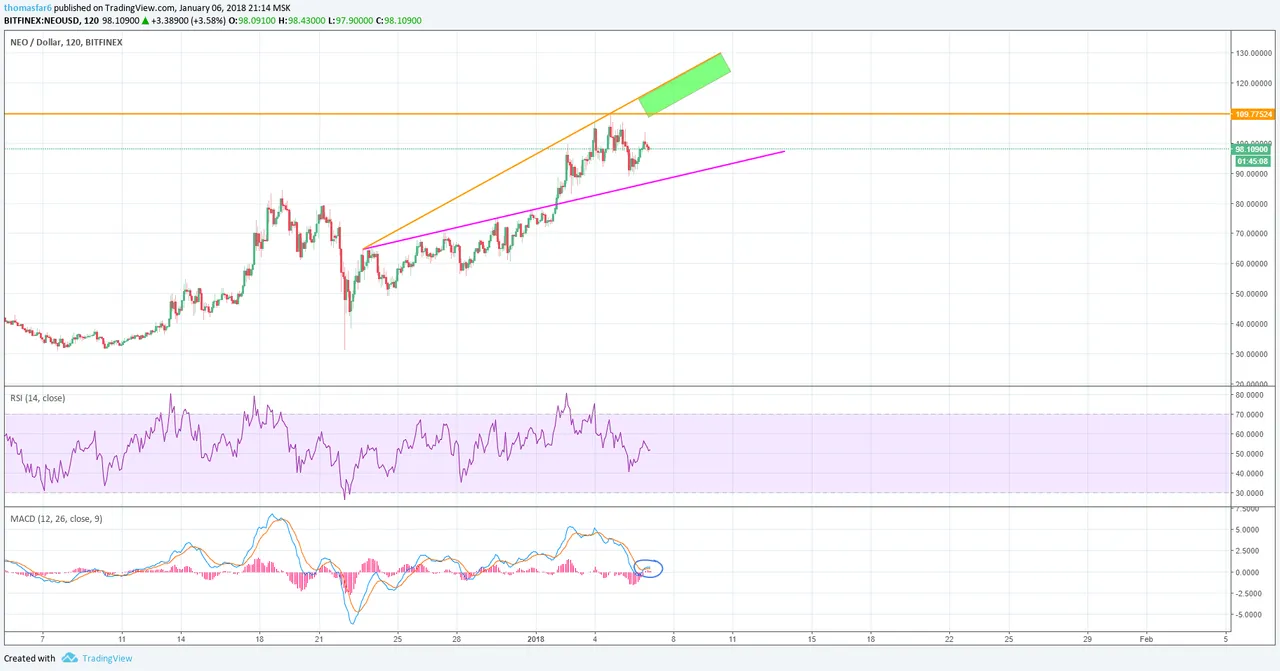
NEO has finally broken through the $100 mark over the past days, we have been waiting for this for a while and now we here the price is currently fighting the $100 as is proving to be quite a strong resistance. At the time of writing, we are at $98 and I suspect that there will be some consolidation at this $90 - $100 range before another movement upwards.
The chart indicates two resistance lines and one support line, the support line was a previous resistance and now the price will hold above this line unless it is broken (In this case we would see a drop). However, NEO is looking quite strong and I do not suspect there to be any strong bullish movements over the coming days.
The green rectangle represents the price tag year that Neo could hit in the medium-term future.
- MACD - Lines are ready to break out and are already looking quite bullish .
- RSI - Nothing relatively uniwue about the RSI , price is currently trying to stablise halfway, which is not nescessiarliy a bad thing.
- Orange - Resistance.
- Pink - Support.
As always trade the lines accordingly.